[ad_1]
tum3123
Whenever I come up with a macro investment theme, I like to use that theme as a guide to look for related investments. Recently, I got bullish on Emerging Markets (“EM”) for 2024, as the asset class has underperformed for over a decade. If the global economy holds up, I can see institutional investors rotate out of expensive U.S. stocks into other asset classes like EM bonds and equity.
In fact, according to research from the well-respected institutional asset manager GMO, emerging market equities and bonds are expected to deliver some of the best forward returns based on GMO’s forecasts (Figure 1).
Figure 1 – 7 year forecasted returns (GMO)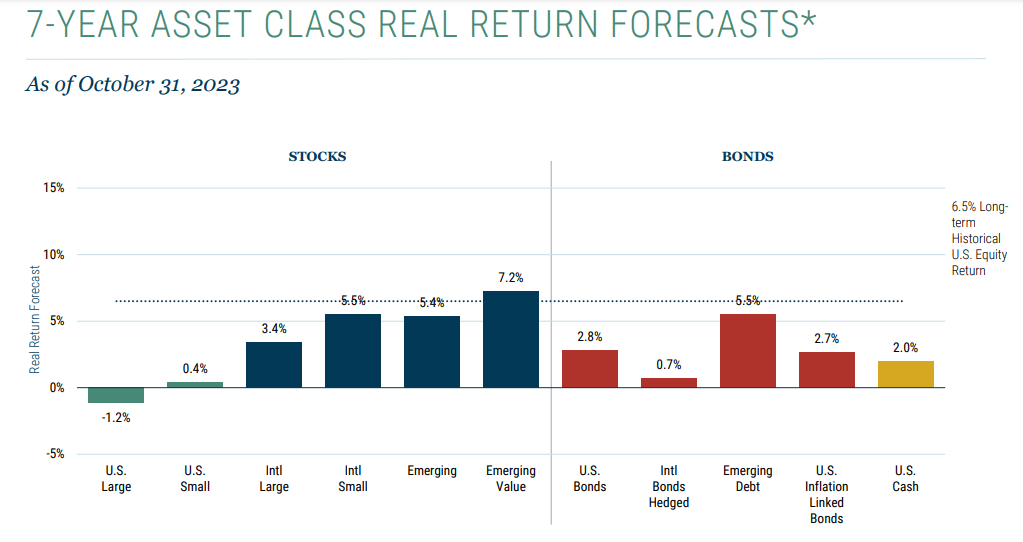
This article reviews the Virtus Stone Harbor Emerging Markets Income Fund (NYSE:EDF). The EDF fund is a sub-scale emerging market debt-focused fund that charges high fees and has poor long-term returns.
While EDF’s poor returns may be a function of the asset class, the biggest knock against the EDF fund is its distribution policy, which pays an unsustainable 16.2% distribution yield that has been historically funded from return of capital. I recommend investors look elsewhere for their EM allocation.
Fund Overview
The Virtus Stone Harbor Emerging Markets Income Fund is a closed-end fund (“CEF”) that invests in emerging market sovereign and corporate debt securities to generate high income and total returns to investors.
The EDF fund is managed by Stone Harbor Investment Partners, an affiliated manager of Virtus Investment Partners. Stone Harbor is a global credit specialist with more than 3 decades of experience in emerging and developed market fixed income securities.
The EDF fund is a small fund with only $128 million in net assets (Figure 2). It charges a net expense ratio of 3.43%.
Figure 2 – EDF overview (virtus.com)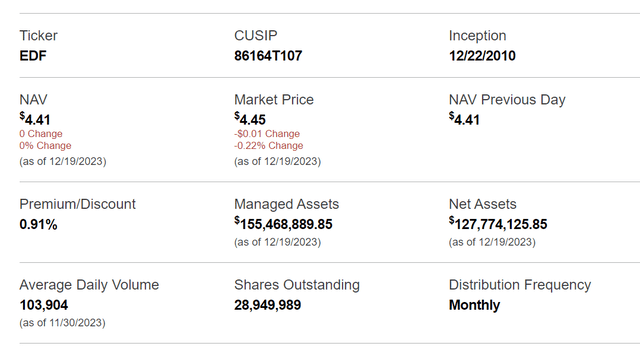
Portfolio Holdings
Figure 3 shows the asset class allocation of the EDF fund. 54.7% of the EDF fund is allocated to hard currency (typically refers to currencies of a developed market like the United States or Europe) sovereign bonds, 26.8% in hard currency corporate bonds, and 17.9% allocation to local currency sovereign bonds.
Figure 3 – EDF asset class allocation (virtus.com)
Geographically, the EDF is mostly allocated to Latin America (52.9%) and Africa (27.6%), with small allocations to Asia (10.4%), Middle East (5.4%), and Europe (3.7%) (Figure 4).
Figure 4 – EDF geographical allocation (virtus.com)
Finally, in terms of credit quality, the EDF fund’s largest allocations are to BBB-rated credits (26.8%), BB-rated (12.9%), and B-rated (28.2%). It also has a significant 28.5% allocation to CCC-rated or below credits (Figure 5).
Figure 5 – EDF credit quality allocation (virtus.com)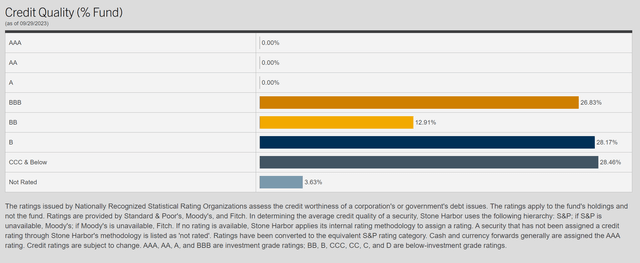
Returns
Figure 6 shows the historical performance of the EDF fund. There are two observations I can make from analyzing EDF’s historical returns. First, the EDF is a very volatile fund, as its annual returns regularly range from -20% to +20% in any given year.
Figure 6 – EDF historical return (morningstar.com)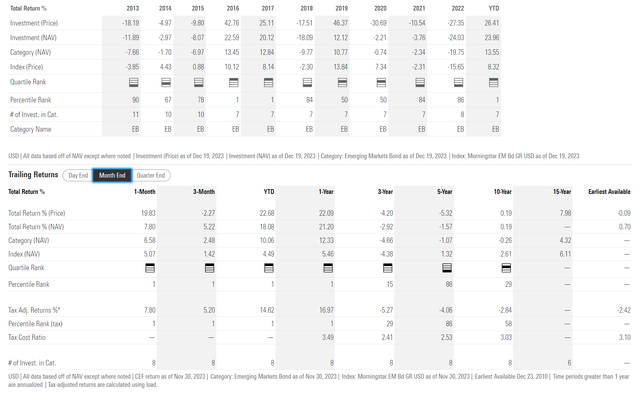
Secondly, although short-term performance for the EDF fund has been strong, the EDF fund has returned 21.2% on a 1 year basis to November 30, 2023, when we look at longer-term time horizons, EDF’s historical returns have been very poor. The EDF fund has 3/5/10 yr average annual returns of -2.9%/-1.6%/0.2%, respectively.
Part of the issue may be the emerging market bonds asset class itself, as the iShares J.P.Morgan USD Emerging Markets Bond ETF (EMB), a passive ETF tracking emerging market bonds, has returned -5.0%/0.8%/2.3%, respectively, on the same time frames (Figure 7).
Figure 7 – EMB historical returns (morningstar.com)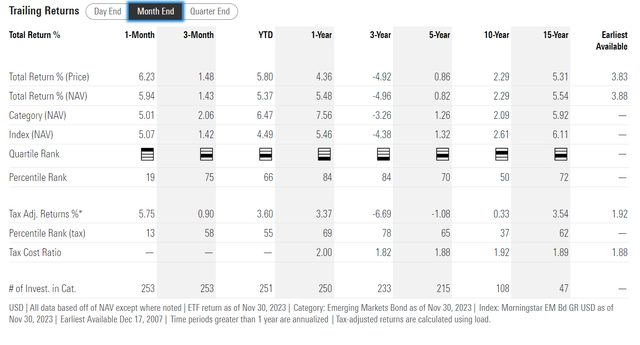
However, even compared to the EMB ETF, the EDF fund has lagged on a 5 and 10 year basis.
Distribution & Yield
Despite poor total returns, the EDF fund has been paying a very attractive $0.06 / month distribution yield, which works out to a forward yield of 16.2% on EDF’s market price (Figure 8).
Figure 8 – EDF pays a hefty 16.2% yield (Seeking Alpha)
While EDF’s distribution yield looks attractive, if we look beneath the hood, we can see that the EDF fund hardly earns its distribution, with the vast majority of historical distributions coming from return of capital (“ROC”) (Figure 9).
Figure 9 – EDF’s distribution mostly funded through return of capital (EDF semi-annual report)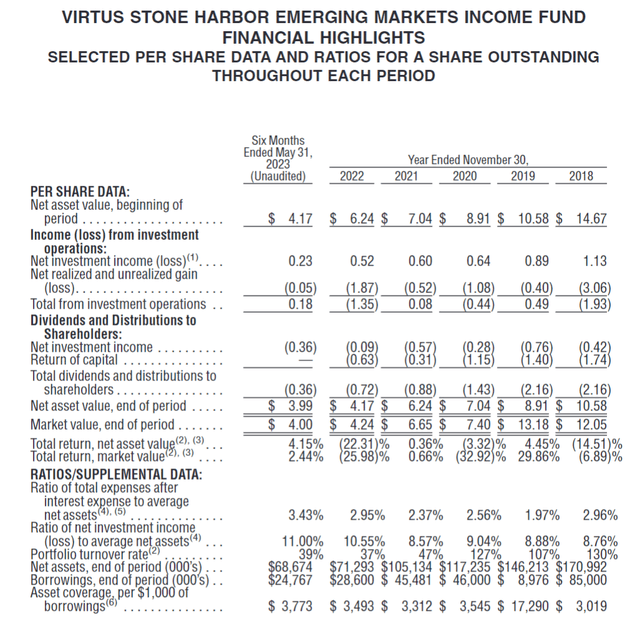
Funds that do not earn their distributions are also called ‘return of principal’ funds, and they are characterized by amortizing net asset values (“NAV”) and shrinking distributions. Investors should avoid return of principal funds as they tend to lead to both a loss of principal (as market price tracks shrinking NAV) and income (as NAV shrinks, there are less income earning assets to pay future distributions).
Figure 10 shows the historical NAV and market price of the EDF fund, confirming it as an amortizing ‘return of principal’ fund. EDF’s NAV has shrunk more than 80% from $24 at the end of 2010 to only $4.41 currently.
Figure 10 – EDF has a shrinking NAV and market price (morningstar.com)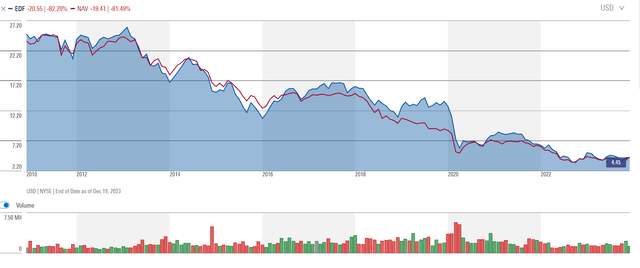
Likewise, EDF’s annual distribution has shrunk from $2.16 / year when the fund first launched to only $0.72 currently (Figure 11).
Figure 11 – EDF has a shrinking distribution (Seeking Alpha)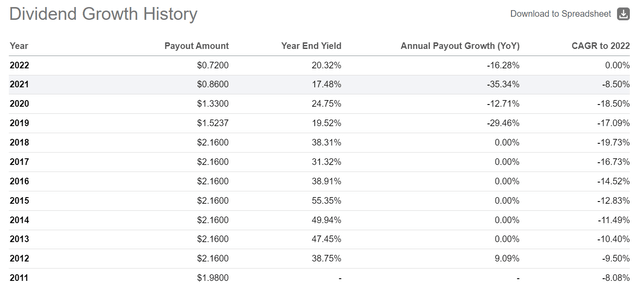
Fund Merger Bolsters Fund Assets…For Now
Recently, the EDF fund merged with the Virtus Stone Harbor Emerging Markets Total Income Fund (“EDI”). The merger added approximately $50 million in assets to the EDF fund. I believe the merger was motivated by a desire to reduce fund expenses, as both funds were sub-scale and charged high fees. A merged fund may be able to spread management fees over a larger pool of assets.
However, with the EDF fund continuing to pay out its ultra-high distribution yield, I believe the merger of the two funds is only a stop-gap measure. In a few years’ time, assuming long-term investment performance does not improve and the distribution rate is not reduced, assets in the EDF fund will once again shrink to the point where the EDF fund will be sub-scale.
Conclusion
While I have a positive view of emerging market assets, I would recommend investors avoid the Virtus Stone Harbor Emerging Markets Income Fund. The EDF fund charges a hefty 3.43% net expense ratio and has delivered poor long-term returns. However, despite its poor track record, the EDF fund pays a 16.2% distribution yield.
Looking beyond EDF’s headline yield, we need to consider the fact that EDF has all the hallmarks of being an amortizing ‘return of principal’ fund. Investors in ‘return of principal’ funds tend to lose both principal and income in the long run. For the EDF fund, its NAV has shrunk by over 80% since inception and its distribution rate has decreased by 67%.
[ad_2]
Source link

