[ad_1]
Master Limited Partnerships – or MLPs, for short – are some of the most misunderstood investment vehicles in the public markets. And that’s a shame because the typical MLP offers:
Tax-advantaged income
High yields well in excess of market averages
The bulk of corporate cash flows returned to shareholders through distributions
An example of a ‘normal’ MLP is an organization involved in the midstream energy industry. Midstream energy companies are in the business of transporting oil, primarily through pipelines. Pipeline companies make up the vast majority of MLPs.
Since MLPs widely offer high yields, they are naturally appealing to income investors. With this in mind, we created a full downloadable list of nearly 100 MLPs in our coverage universe.
You can download the Excel spreadsheet (along with relevant financial metrics like dividend yield and payout ratios) by clicking on the link below:

This comprehensive article covers MLPs in depth, including the history of MLPs, unique tax consequences, and risk factors of MLPs, as well as our 7 top-ranked MLPs today.
The table of contents below allows for easy navigation of the article:
Table of Contents
The History of Master Limited Partnerships
MLPs were created in 1981 to allow certain business partnerships to issue publicly traded ownership interests.
The first MLP was Apache Oil Company, which was quickly followed by other energy MLPs, and then real estate MLPs.
The MLP space expanded rapidly until a great many companies from diverse industries operated as MLPs – including the Boston Celtics basketball team.
One important trend over the years is that energy MLPs have grown from being roughly one-third of the total MLP universe to contain the vast majority of these securities.
Moreover, the energy MLP universe has evolved to be focused on midstream energy operations. Midstream partnerships have grown to be roughly half of the total number of energy MLPs.
MLP Tax Consequences
Master limited partnerships are tax-advantaged investment vehicles. They are taxed differently than corporations. MLPs are pass-through entities. They are not taxed at the entity level.
Instead, all money distributed from the MLP to unit holders is taxed at the individual level.
Distributions are ‘passed through’ because MLP investors are actually limited partners in the MLP, not shareholders. Because of this, MLP investors are called unit holders, not shareholders.
And, the money MLPs payout to unit holders is called a distribution (not a dividend).
The money passed through from the MLP to unit holders is classified as either:
MLPs tend to have lots of depreciation and other non-cash charges. This means they often have income that is far lower than the amount of cash they can actually distribute. The cash distributed less the MLP income is a return on capital.
A return of capital is not technically income, from an accounting and tax perspective. Instead, it is considered as the MLP actually returning a portion of its assets to unit holders.
Now here’s the interesting part… Returns of capital reduce your cost basis. That means taxes for returns of capital are only due when you sell your MLP units. Returns of capital are tax-deferred.
Note: Return of capital taxes are also due in the event that your cost basis is less than $0. This only happens for very long-term holding, typically around 10 years or more.
Each individual MLP is different, but on average an MLP distribution is usually around 80% to 90% a return of capital, and 10% to 20% ordinary income.
This works out very well from a tax perspective. The images below compare what happens when a corporation and an MLP each have the same amount of cash to send to investors.
Note 1: Taxes are never simple. Some reasonable assumptions had to be made to simplify the table above. These are listed below:
Corporate federal income tax rate of 21%
Corporate state income tax rate of 5%
Qualified dividend tax rate of 20%
Distributable cash is 80% a return of capital, 20% ordinary income
Personal federal tax rate of 22% less 20% for passive entity tax break(19.6% total instead of 22%)
Personal state tax rate of 5% less 20% for passive entity tax break(4% total instead of 5%)
Long-term capital gains tax rate of 20% less 20% for passive entity tax break(16% total instead of 20%)
Note 2: The 20% passive income entity tax break will expire in 2025.
Note 3: In the MLP example, if the maximum personal tax rate of 37% is used, the distribution after all taxes is $8.05.
Note 4: In the MLP example, the accrued cost basis reduction tax is due when the MLP is sold, not annually come tax time.
As the tables above show, MLPs are far more efficient vehicles for returning cash to shareholders relative to corporations. Additionally, in the example above $9.57 out of $10.00 distribution would be kept by the MLP investor until they sold because the bulk of taxes are from returns of capital and not due until the MLP is sold.
Return of capital and other issues discussed above do not matter when MLPs are held in a retirement account.
There is a different issue with holding MLPs in a retirement account, however. This includes 401(k), IRA, and Roth IRA accounts, among others.
When retirement plans conduct or invest in a business activity, they must file separate tax forms to report Unrelated Business Income (UBI) and may owe Unrelated Business Taxable Income (UBTI). UBTI tax brackets go up to 37% (the top personal rate).
MLPs issue K-1 forms for tax reporting. K-1s report business income, expense, and loss to owners. Therefore, MLPs held in retirement accounts may still qualify for taxes.
If UBI for all holdings in your retirement account is over $1,000, you must have your retirement account provider (typically, your brokerage) file Form 990-T.
You will want to file form 990-T as well if you have a UBI loss to get a loss carryforward for subsequent tax years. Failure to file form 990-T and pay UBIT can lead to severe penalties.
Fortunately, UBIs are often negative. It is a fairly rare occurrence to owe taxes on UBI.
The subject of MLP taxation can be complicated and confusing. Hiring a tax professional to aid in preparing taxes is a viable option for dealing with the complexity.
The bottom line is this: MLPs are tax-advantaged vehicles that are suited for investors looking for current income. It is fine to hold them in either taxable or non-taxable (retirement) accounts.
Since retirement accounts are already tax-deferred, holding MLPs in taxable accounts allows you to ‘get credit’ for the full effects of their unique structure.
4 Advantages & 6 Disadvantages of Investing in MLPs
MLPs are a unique asset class. As a result, there are several advantages and disadvantages to investing in MLPs. Many of these advantages and disadvantages are unique specifically to MLPs.
Advantages of MLPs
Advantage #1: Lower taxes
MLPs are tax-advantaged securities, as discussed in the “Tax Consequences” section above. Depending on your individual tax bracket, MLPs are able to generate around 40% more after-tax income for every pre-tax dollar they decide to distribute, versus Corporations.
Advantage #2: Tax-deferred income through returns of capital
In addition to lower taxes in general, 80% to 90% of the typical MLPs distributions are classified as returns of capital. Taxes are not 0wed (unless cost basis falls below 0) on return of capital distributions until the MLP is sold.
This creates the favorable situation of tax-deferred income.
Tax-deferred income is especially beneficial for retirees as return on capital taxes may not need to be paid throughout retirement.
Advantage #3: Diversification from other asset classes
Investing in MLPs provides added diversification in a balanced portfolio. Diversification can be measured by the correlation in return series between asset classes.
MLPs are excellent diversifiers, having either a near zero or negative correlation to corporate bonds, government bonds, and gold.
Additionally, they have a correlation coefficient of less than 0.5 to both REITs and the S&P 500. This makes MLPs an excellent addition to a diversified portfolio.
Advantage #4: Typically very high yields
MLPs tend to have high yields far in excess of the broader market. As of this writing, the S&P 500 yields ~2.1%, while the Alerian MLP ETF (AMLP) yields over 25%. Many individual MLPs have yields above 10%.
Disadvantages of MLPs
Disadvantage #1: Complicated tax situation
MLPs can create a headache come tax season. MLPs issue K-1’s and are generally more time-consuming and complicated to correctly calculate taxes than ‘normal’ stocks.
Disadvantage #2: Potential additional paperwork if held in a retirement account
In addition, MLPs create extra paperwork and complications when invested through a retirement account because they potentially create unrelated business income (UBI). See the “Tax Consequences” section above for more on this.
Disadvantage #3: Little diversification within the MLP asset class
While MLPs provide significant diversification versus other asset classes, there is little diversification within the MLP structure.
The vast majority of publicly traded MLPs are oil and gas pipeline businesses. There are some exceptions, but in general MLP investors are investing in energy pipelines and not much else.
Because of this, it would be unwise to allocate all or a majority of one’s portfolio to this asset class.
Disadvantage #4: Incentive Distribution Rights (IDRs)
MLP investors are limited partners in the partnership. The MLP form also has a general partner.
The general partner is usually the management and ownership group that controls the MLP, even if they own a very small percentage of the actual MLP.
Incentive Distribution Rights, or IDRs, are used to ‘incentivize’ the general partner to grow the MLP.
IDRs typically allocate greater percentages of cash flows to go to the general partner (and not to the limited partners) as the MLP grows its cash flows.
This reduces the MLPs ability to grow its distributions, putting a handicap on distribution increases.
It should be noted that not all MLPs have IDRs, but the majority do.
Disadvantage #5: Elevated risk of distribution cuts due to high payout ratios
One of the big advantages of investing in MLPs is their high yields. Unfortunately, high yields very often come with high payout ratios.
Most MLPs distribute nearly all of the cash flows they make to unit holders. In general, this is a positive.
However, it creates very little room for error.
The pipeline business is generally stable, but if cash flows decline unexpectedly, there is almost no margin of safety at many MLPs. Even a short-term disturbance in business results can necessitate a reduction in the distribution.
Disadvantage #6: Growth Through Debt & Share Issuances
Since MLPs typically distribute virtually all of their cash flows as distributions, there is very little money left over to actually grow the partnership.
And most MLPs strive to grow both the partnership, and distributions, over time. To do this, the MLP’s management must tap capital markets by either issuing new units or taking on additional debt.
When new units are issued, existing unit holders are diluted; their percentage of ownership in the MLP is reduced.
When new debt is issued, more cash flows must be used to cover interest payments instead of going into the pockets of limited partners through distributions.
If an MLPs management team starts projects with lower returns than the cost of their debt or equity capital, it destroys unit holder value. This is a real risk to consider when investing in MLPs.
The 7 Best MLPs Today
The 7 best MLPs are ranked and analyzed below using expected total returns from the Sure Analysis Research Database. Expected total returns consist of 3 elements:
Return from change in valuation multiple
Return from distribution yield
Return from growth on a per-unit basis
The top MLPs list was screened further on a qualitative assessment of a company’s dividend risk.
Specifically, MLPs with a Dividend Risk score of ‘F’ according to the Sure Analysis Research Database were omitted from the list.
Additionally, MLPs with current distribution yields below 2% were not considered. This screen makes the list more attractive to income investors.
Continue reading for detailed analysis on each of our top MLPs, ranked according to expected 5-year annual returns.
MLP #7: Lazard Ltd. (LAZ)
5-year expected annual returns: 11.7%
Lazard Ltd. is an international investment advisory company that traces its history to 1848. The company has two business segments: Financial Advisory and Asset Management. The Financial Advisory business includes M&A, debt restructuring, capital raising, and other advisory business. The Asset Management business is about 80% equities and focuses primarily on institutional clients.
By geography, Lazard’s revenue is about 60% Americas, 30% Europe and Middle East, and 10% Asia Pacific. Revenue is almost 50% Financial Advisory and 50% Asset Management. At the end of Q3 2022 Lazard had roughly $198B in assets under management (AUM).
Lazard reported surprisingly good Q3 2022 results on October 27th, 2022. Companywide operating revenue increased 3% to $724M from $702M and diluted adjusted earnings per share gained 7% to $1.05 from $0.98 on year-over-year basis on more M&A deals and debt restructuring offset by lower assets under management (AUM). The European Financial Advisory business is having a record year, so far.
Financial Advisory operating revenue was $454M, which was up 19% from $381M in the prior year. Lazard has been engaged in Intel’s $30B investment with Brookfield, Orange’s combination with Masmovil, Cargill’s acquisition of Sanders Farms, Bungie’s sale to Sony Interactive Entertainment, and many other deals.
Lazard’s Asset Management operating revenue decreased (-15%) to $263M from $311M in comparable periods. Average AUM fell (-24%) to $212B from $278B in the prior year and decreased (-8%) in sequential quarters. The decline was driven by net outflows of (-$2.0B), market action loss of (-$10.3B), and foreign exchange depreciation of (-$6.6B).
Click here to download our most recent Sure Analysis report on LAZ (preview of page 1 of 3 shown below):
MLP #6: Magellan Midstream Partners LP (MMP)
5-year expected annual returns: 12.7%
Magellan has the longest pipeline system of refined products, which is linked to nearly half of the total U.S. refining capacity.
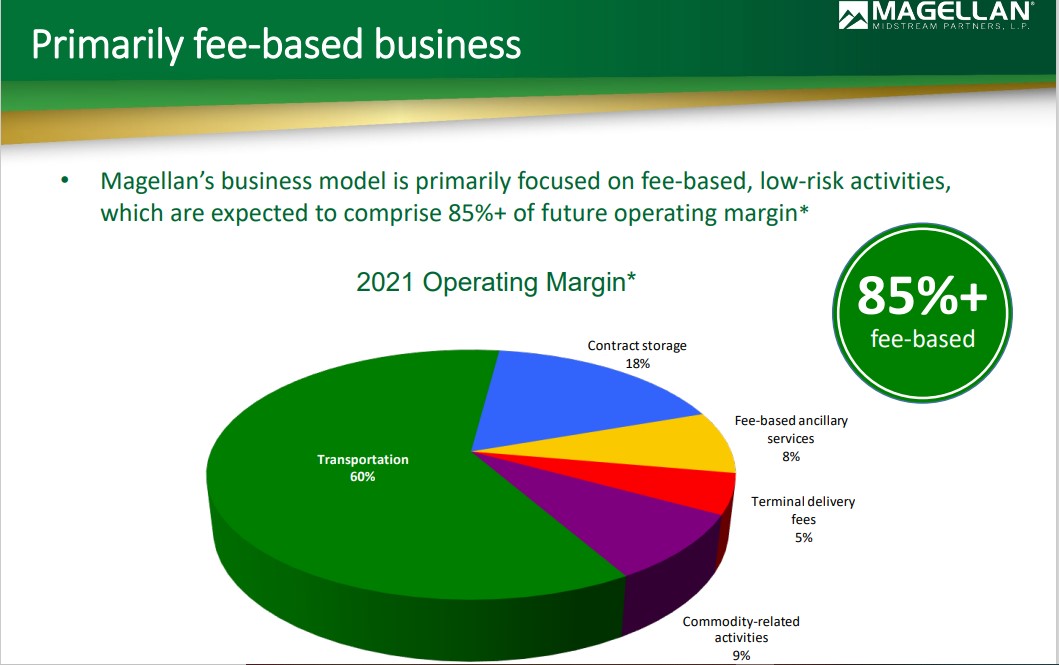
This segment generates ~65% of its total operating income while the transportation and storage of crude oil generates ~35% of its operating income. MMP has a fee-based model; only ~9% of its operating income depends on commodity prices.
Source: Investor Presentation
In late October, MMP reported (10/27/22) financial results for the third quarter of fiscal 2022. Distributable cash flow grew 5% over the prior year’s quarter, mostly thanks to increased volumes of refined products. Adjusted earnings-pershare of $1.29 exceeded the analysts’ consensus by $0.14.
MMP has proved resilient to the pandemic. It recently raised its distribution by 1% and expects a distribution coverage ratio slightly above 1.25 for the full year. Moreover, management marginally raised its guidance for the annual distributable cash flow, from $1.09 billion to $1.10 billion.
The company has a positive growth outlook, due to its lineup of growth projects underway. The company invested has more than $500 million of potential growth projects under consideration. In addition, share repurchases may constitute another significant growth driver.
Click here to download our most recent Sure Analysis report on MMP (preview of page 1 of 3 shown below):
MLP #5: Holly Energy Partners (HEP)
5-year expected annual returns: 12.7%
Holly Energy Partners is responsible for transporting and storing crude oil and refined products. The company operates its own crude oil and petroleum pipelines and storage terminals in ten U.S. states, including Texas, Nevada and Washington. HEP also has refinery facilities in Utah and Kansas.
Nearly all the revenues of HEP are fee-based. As a result, in the downturn of the oil market during 2014-2017, while other MLPs saw their earnings collapse, HEP grew its earnings-per-share and its distributable cash flow per share by 76% and 52%, respectively.
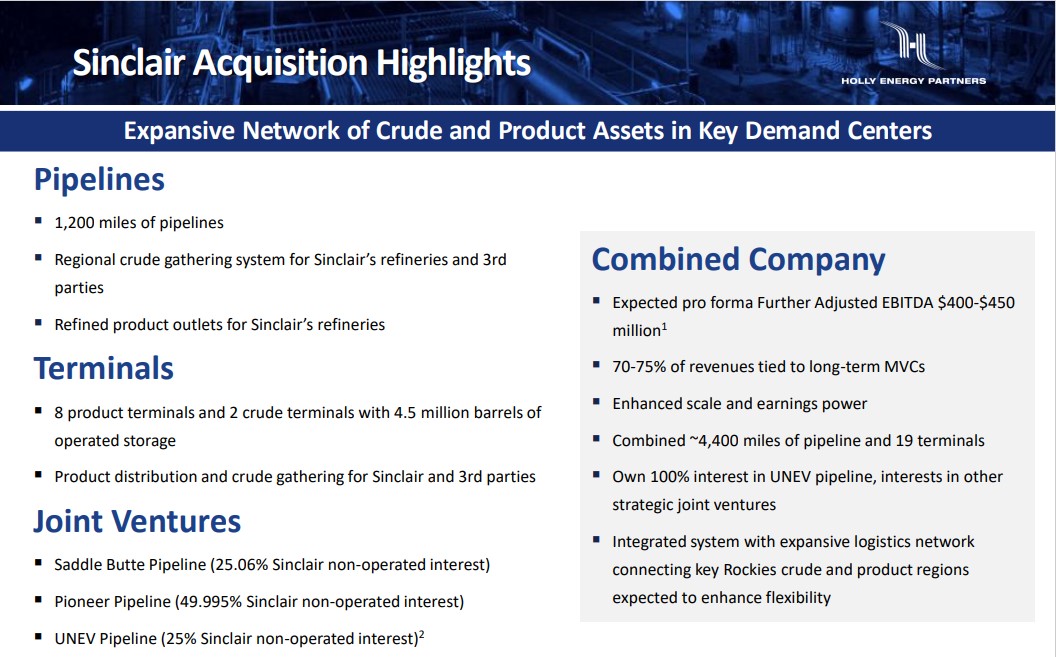
On March 14th, 2022, HEP completed the acquisition of the pipelines and terminal assets of Sinclair Transportation. The deal includes 1,200 miles of pipelines of crude oil and products, 8 product terminals and 2 crude terminals. HEP paid $325 million and issued 21 million of common units to pay for the deal, which is valued at $758 million.
Source: Investor Presentation
Due to the pandemic, HEP cut its quarterly distribution by -48% in 2020, from $0.69 to $0.35, after 60 consecutive quarters without a cut.
However, HEP has recovered strongly from the pandemic, with its current volumes nearly at pre-COVID levels. The resilient DCF of HEP is a testament to the strength of its business model. As HEP currently has a distribution coverage ratio of 1.8, we consider the new distribution safe.
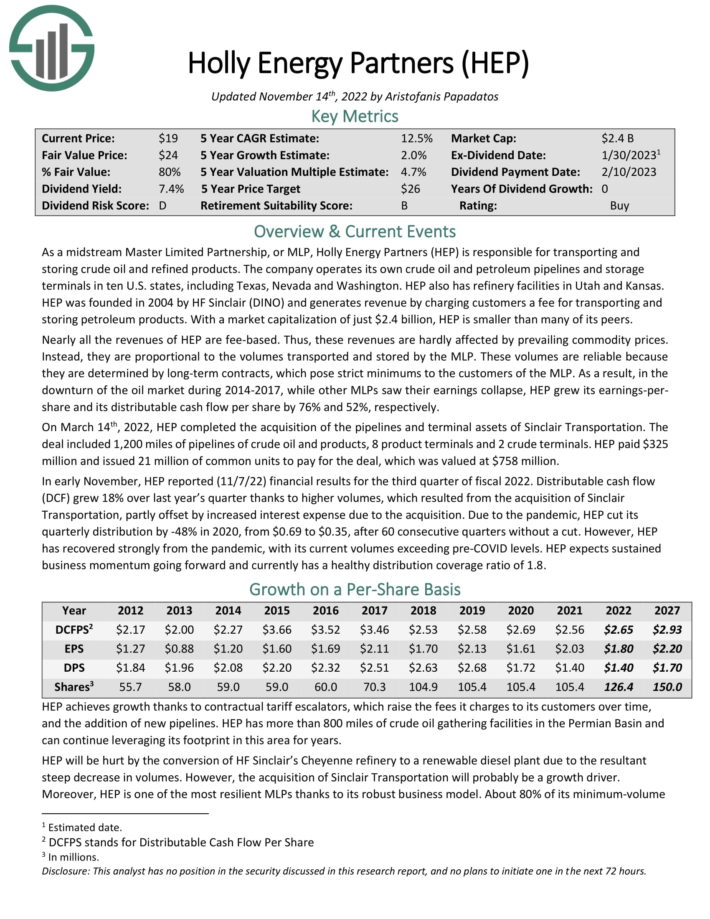
Click here to download our most recent Sure Analysis report on HEP (preview of page 1 of 3 shown below):
MLP #4: Brookfield Infrastructure Partners LP (BIP)
5-year expected annual returns: 13.8%
Brookfield Infrastructure Partners L.P. is one of the largest global owners and operators of infrastructure networks, which includes operations in sectors such as energy, water, freight, passengers, and data. Brookfield Infrastructure Partners is one of four publicly-traded listed partnerships that is operated by Brookfield Asset Management (BAM).
BIP reported positive Q3 2022 results on 11/2/22. For the quarter, its funds-from-operations (FFO) 24% to $525 million. On a per-unit basis, its FFO climbed 15% to $0.68. FFO growth was driven by the midstream and transport segments.
FFO for the utilities and data segments also increased but at a smaller scale. The year-to-date results provide a bigger picture. FFO growth was 23% to $1,531 million, and FFOPU increased by 12% to $1.99, illustrating the essential nature of its business that generates quality cash flows that are highly regulated or have contracted revenues.
Click here to download our most recent Sure Analysis report on BIP (preview of page 1 of 3 shown below):
MLP #4: NextEra Energy Partners LP (NEP)
5-year expected annual returns: 14.2%
NextEra Energy Partners was formed in 2014 as Delaware Limited Partnership by NextEra Energy to own, operate, and acquire contracted clean energy projects with stable, long-term cash flows. The company’s strategy is to capitalize on the energy industry’s favorable trends in North America of clean energy projects replacing uneconomic projects.
NextEra Energy Partners operates 34 contracted renewable generation assets consisting of wind and solar projects in 12 states across the United States. The company also operates contracted natural gas pipelines in Texas which accounts for about a fifth of NextEra Energy Partners’ income. Following the IPO, NextEra Energy (the largest utility company in North America) held 82.6% of NextEra Energy Partners.
On October 28th, 2022 NextEra Energy Partners released Q3 results. It grew distributions per unit approximately 15% year-over-year and completed its previously announced acquisition of approximately 230-megawatt, 4-hour battery storage project from NextEra Energy Resources. Management announced year-end 2023 run-rate adjusted EBITDA and cash available for distribution expectations, up roughly 23% and 12%, respectively.
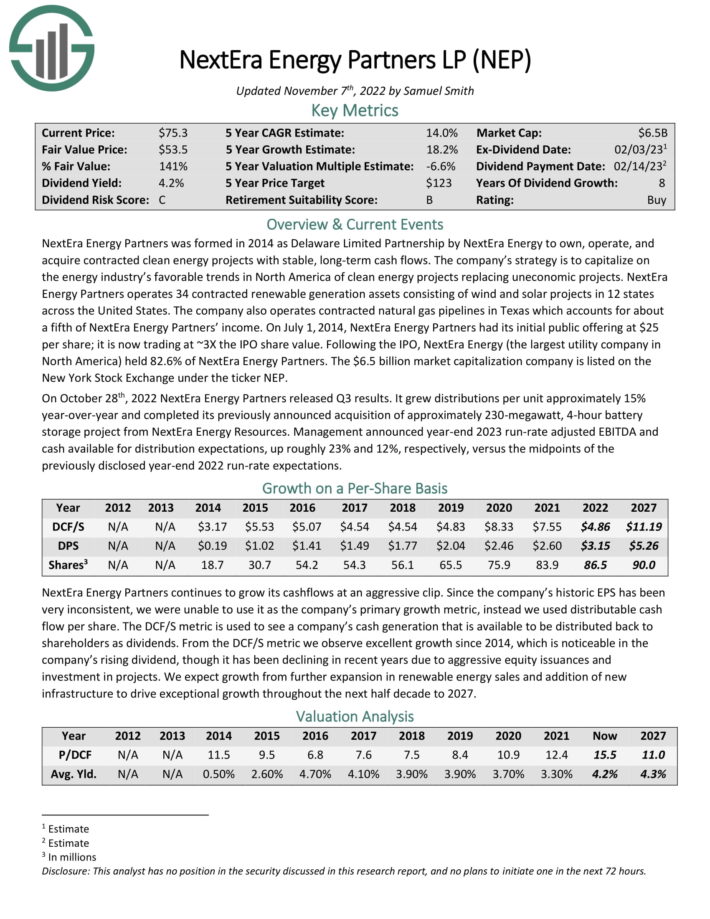
Click here to download our most recent Sure Analysis report on NEP (preview of page 1 of 3 shown below):
MLP #2: Plains All American Pipeline LP (PAA)
5-year expected annual returns: 16.2%
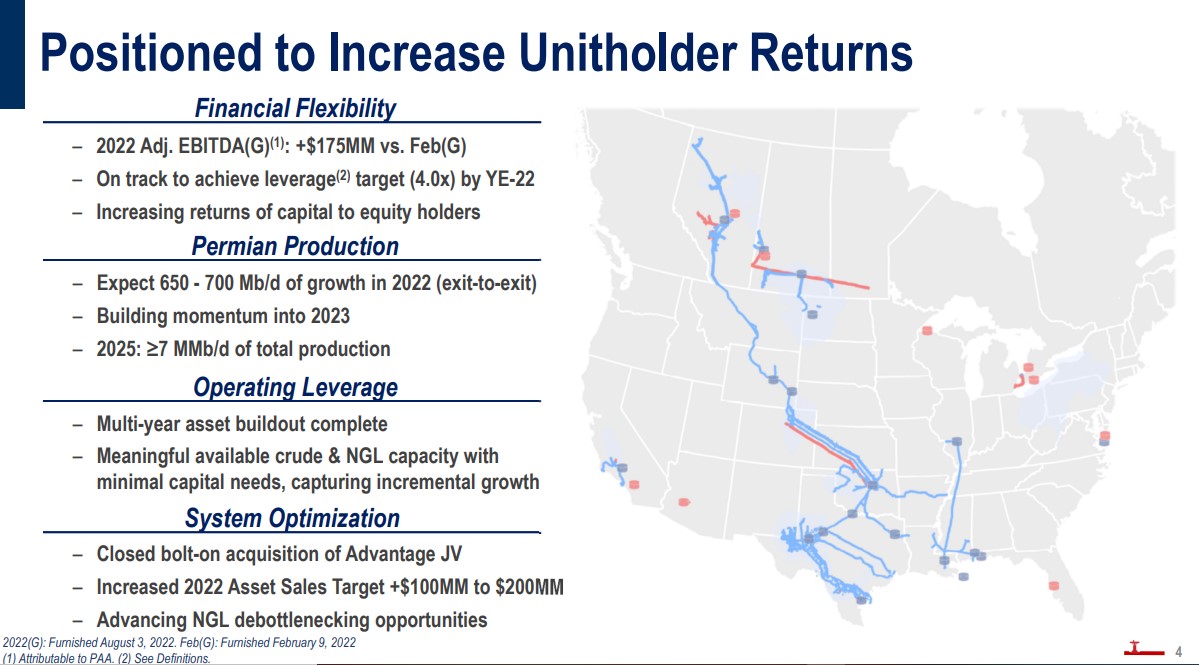
Plains All American Pipeline is a midstream energy infrastructure provider. The company owns an extensive network of pipeline transportation, terminals, storage, and gathering assets in key crude oil and natural gas liquids producing basins at major market hubs in the United States and Canada.
On average, it handles more than 7 million barrels per day of crude oil and NGL through 18,370 miles of active pipelines and gathering systems. Plains All American generates around $40 billion in annual revenues and is based in Houston, Texas.
Source: Investor Presentation
On April 6th, 2022, Plains All American hiked its distribution by 21% to a quarterly rate of $0.2175.
On November 2nd, 2022, Plains All American reported its Q3 results for the period ending September 30th, 2022. Revenues came in at $14.3 billion, an increase of 32.4% year-over-year. The significant increase compared to last year was driven by global crude oil demand following its post-pandemic recovery. Higher global oil prices were also a positive contributor. Finally, increased production in the Permian Basin significantly boosted results, ending the quarter at roughly 5.7 million barrels a day, compared to 4.4 million barrels in the prior-year period.
Distributable cash flows (DCF) grew 17% to $0.55 on a per-unit basis. Unit repurchases over the past year boosted this figure, as aggregate DCF actually grew by 14.2%. Following better-than-expected results, management increased its fullyear 2022 adjusted EBITDA guidance by $75 million to plus or minus $2.450 billion.
Click here to download our most recent Sure Analysis report on PAA (preview of page 1 of 3 shown below):
MLP #1: Alliance Resource Partners LP (ARLP)
5-year expected annual returns: 18.7%
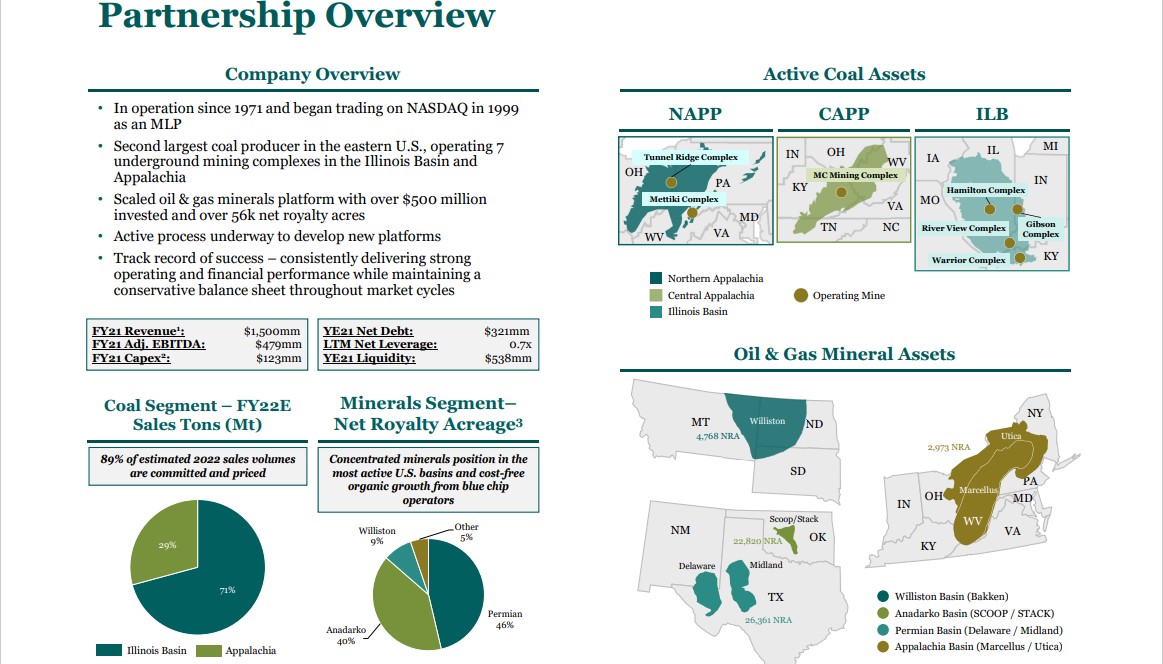
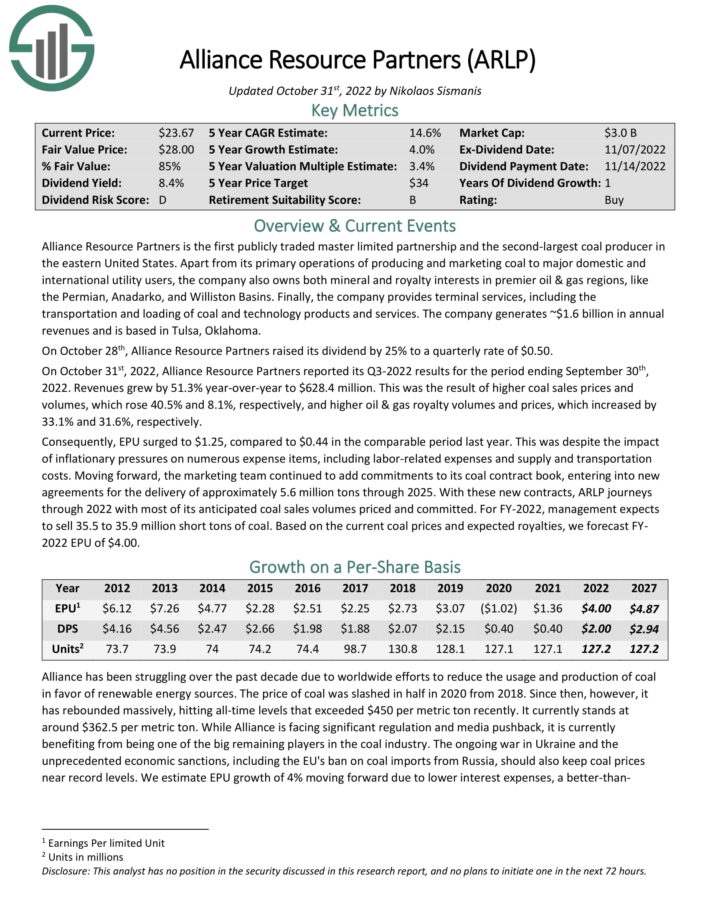
Alliance Resource Partners is the second-largest coal producer in the eastern United States. Apart from its primary operations of producing and marketing coal to major domestic and international utility users, the company also owns both mineral and royalty interests in premier oil & gas regions, like the Permian, Anadarko, and Williston Basins.
Finally, the company provides terminal services, including the transportation and loading of coal and technology products and services. The company generates ~$1.6 billion in annual revenues and is based in Tulsa, Oklahoma.
On July 26th, Alliance Resource Partners raised its dividend by 14.3% to a quarterly rate of $0.40.
On October 31st, 2022, Alliance Resource Partners reported its Q3-2022 results for the period ending September 30th, 2022. Revenues grew by 51.3% year-over-year to $628.4 million. This was the result of higher coal sales prices and volumes, which rose 40.5% and 8.1%, respectively, and higher oil & gas royalty volumes and prices, which increased by 33.1% and 31.6%, respectively.
Moving forward, the marketing team continued to add commitments to its coal contract book, entering into new agreements for the delivery of approximately 24.9 million tons over the balance of this year through 2025. With these new contracts, ARLP journeys through 2022 with most of its anticipated coal sales volumes priced and committed. For FY-2022, management expects to sell 35.5 to 37.0 million short tons of coal.
Click here to download our most recent Sure Analysis report on ARLP (preview of page 1 of 3 shown below):
MLP ETFs, ETNs, & Mutual Funds
There are 3 primary ways to invest in MLPs:
By investing in units of individual publicly traded MLPs
By investing in a MLP ETF or mutual fund
By investing in a MLP ETN
Note: ETN stands for ‘exchange traded note’
The difference between investing directly in a company (normal stock investing) versus investing in a mutual fund or ETF is very clear. It is simply investing in one security versus a group of securities.
ETNs are different. Unlike mutual funds or ETFs, ETNs don’t actually own any underlying shares or units of real businesses. Instead, ETNs are financial instruments backed by the financial institution (typically a large bank) that issued them. They perfectly track the value of an index. The disadvantage to ETNs is that they expose investors to the possibility of a total loss if the backing institution were to go bankrupt.
The advantage to investing in a MLP ETN is that distribution income is tracked, but paid via a 1099. This eliminates the tax disadvantages of MLPs (no K-1s, UBTI, etc.). This unique feature may appeal to investors who don’t want to hassle with a more complicated tax situation. The J.P. Morgan Alerian MLP ETN makes a good choice in this case.
Purchasing individual securities is preferable for many, as it allows investors to concentrate on their best ideas. But ETFs have their place as well, especially for investors looking for diversification benefits.
Final Thoughts
Master Limited Partnerships are a misunderstood asset class. They offer diversification, tax-advantaged and tax-deferred income, high yields, and have historically generated excellent total returns. You can download your free copy of all MLPs by clicking on the link below:

The asset class is likely under-appreciated because of its more complicated tax status.
MLPs are generally attractive for income investors, due to their high yields.
As always, investors need to conduct their own due diligence regarding the unique tax effects and risk factors before purchasing MLPs.
The MLPs on this list could be a good place to find long-term buying opportunities among the beaten-down MLPs. To see the highest-yielding MLPs, click here.
Additionally, MLPs are not the only way to find high levels of income. The following lists contain many more stocks that regularly pay rising dividends.
Thanks for reading this article. Please send any feedback, corrections, or questions to support@suredividend.com.
[ad_2]


