[ad_1]
Introduction
Alliance Resource Partners (NASDAQ:ARLP) began exploring new investments to diversify away from thermal coal earlier in 2022 but alas, only several months later and they were already falling back to their old ways as these were seemingly pushed aside, as my previous article discussed. Fast-forward to early 2023 and unitholders are enjoying their better-than-expected results for the fourth quarter of 2022 and guidance for the year ahead, not to mention a record-setting distribution. Despite these helping their unit price pop higher in recent days, it nevertheless is still beneath its 52-week high and thus paints an ominous picture for the years ahead.
Coverage Summary & Ratings
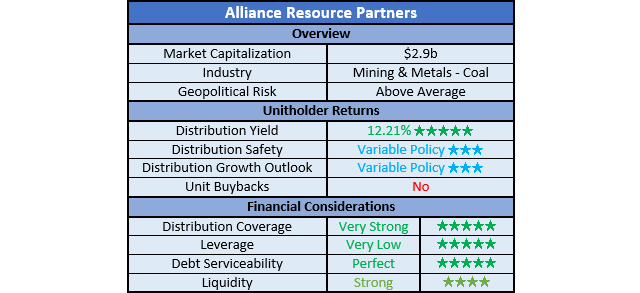
Since many readers are likely short on time, the table below provides a brief summary and ratings for the primary criteria assessed. If interested, this Google Document provides information regarding my rating system and importantly, links to my library of equivalent analyses that share a comparable approach to enhance cross-investment comparability.
Author
Detailed Analysis
Author
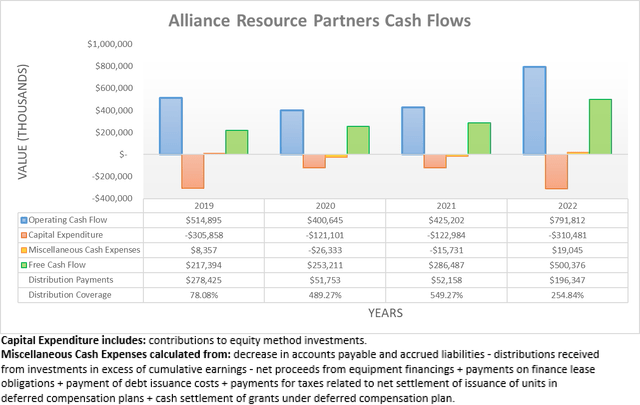
Thanks to the booming coal prices during 2022, largely on the back of the Russia-Ukraine war, it made for a very strong end to the year with their operating cash flow closing out the books at $791.8m. In fact, they almost brought in two years of operating cash flow during 2022 alone, as their results for 2020 and 2021 were $400.6m and $425.2m, respectively. Quite obviously, this left tons of free cash flow, which itself landed at $500.4m during 2022, once again almost equaling their combined results of $253.2m and $286.5m during 2020 and 2021, respectively.
Author
When viewed quarterly, the impressiveness of their result during the fourth quarter of 2022 is easily apparent with their reported operating cash flow of $243.3m far above what they would routinely have generated in the past. That said, it is nevertheless still slowing versus their massive result of $313.2m during the third quarter but alas, volatility is merely par for the course when it comes to commodity prices.
Whilst their results for 2023 remain to be seen, they have issued strong guidance with seemingly stronger pricing versus that of 2022 and solid coal production, which sets a positive base. Plus, their latest quarterly distribution of $0.70 per unit is 40% higher quarter-on-quarter and actually beats anything in their history. When these variables are combined, it would normally be a reason for celebration and whilst these are certainly very positive events in isolation, I feel there is another way to view this situation.
Generally speaking, it would be reasonable to expect a record-setting distribution to be accompanied by a record-setting unit price but alas, not in this situation as it fails to reclaim its 52-week highs and remains barely half its level years ago during 2014. Since their unit price is obviously driven by supply and demand, this sends a signal the market is losing interest in their units, as the supply of their units remains static. Even though the market is not always correct, I see this as painting an ominous picture for the years ahead because the appeal of their units is likely to be further tarnished and if the market is already losing interest in their units, it is difficult to generate profits ahead for unitholders.
The biggest driving force behind their booming financial performance during 2022 was obviously the global energy shortage, which was supercharged by the Russian invasion of Ukraine, as everyone knows. Whilst this lined their pockets immensely and help propel their unit price higher earlier in the year, energy markets will always find a way to rebalance and regardless of their strong guidance for 2023, these abnormal times cannot continue forever, especially for thermal coal.
Like it or not, their primary production, thermal coal is a fuel of last resort because no one burns it unless another alternative fuel is unavailable or too expensive, quite commonly natural gas. The latter saw its prices surge to levels not seen in many years as Europe scrambled to replace as much Russian supply with LNG as possible, thereby helping lift the price of thermal coal in tandem as gas-to-coal switching occurred in response to natural gas supply shortages.
The recent months have seen natural gas prices plummet everywhere from Europe to the United States as supply concerns ease, thereby removing one of the big driving forces behind increased thermal coal demand. Whilst I still see a bullish medium to long-term backdrop for natural gas given the massive loss of Russian supply into Europe, this does not automatically mean cripplingly high prices that facilitate additional thermal coal demand well into the future. Not to mention that natural gas is a reasonably plentiful resource in the United States and elsewhere, thereby providing scope for production growth as the years pass. Plus, solar and wind will continue to see their costs edge lower over the years as technology keeps advancing, thereby further displacing thermal coal demand.
In light of this sour medium to long-term outlook, it is not hard to see why investors are not rushing into grabbing their record-setting distribution. Whereas in the short term, the widely discussed prospects of weaker economic conditions in the United States also pose headwinds, as this stands to pull back on energy demand and give further room for thermal coal to be displaced. Since the future direction of their unit price is going to be reflective of their financial performance further afield than 2023, I expect these considerations to weigh heavily as the year progresses and the outlook for 2024 and beyond weakens.
Author
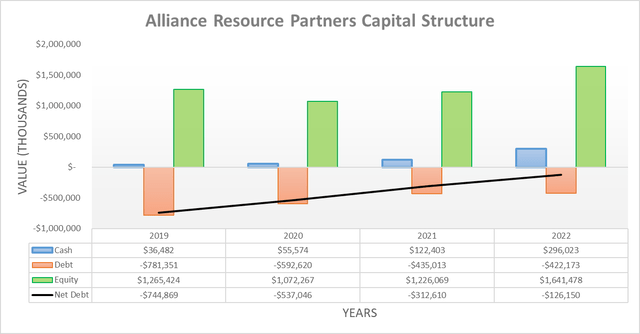
Due to their cash flow performance slowing and distribution payments increasing during the fourth quarter of 2022, their net debt only decreased slightly to $126.2m versus its previous level of $146.6m following the third quarter. Whilst I expect their cash flow performance will ease significantly during 2023 and beyond, it nevertheless seems apparent their net debt will be eliminated in the foreseeable future given their progress during 2021 and 2022, or if not, it will keep sliding lower and become even less material as the quarters pass.
When considering this outlook, it would be pointless to spend time reviewing their leverage or debt serviceability in detail, as these are obviously both not problematic at the moment and likely to cease being topics in the short term. To the former point, even their beaten-down operating cash flow of $400.6m during 2020 would be many magnitudes above their net debt, thereby meaning very low leverage and by extension, it also means their debt serviceability is also fine.
Author
To zero surprise, their swelling cash balance during the fourth quarter of 2022 saw their respective current and cash ratios increase to 2.56 and 1.16 versus their previous results of 2.34 and 1.10 following the third quarter. When combined with their aforementioned outlook to potentially see their net debt eliminated, this strong liquidity removes concerns over debt maturities and debt market access despite financial institutions often shying away from thermal coal on ESG grounds, which is one bright spot in this otherwise somber analysis.
Conclusion
Whilst the future is never certain, the fact that record-setting distributions failed to see their unit price reclaim its 52-week high is concerning, at least in my eyes. Yes, the market is not always right but in this situation, I feel this is an ominous warning sign for their future that shows a lack of interest in their units. As soon as the proverbial tide recedes, likely in 2023 as natural gas prices moderate and weaker economic conditions take hold, thermal coal will once again be pushed aside as a fuel of last resort, like it or not.
This should see their unit price follow in tandem and thus, I still believe that my sell rating is appropriate because I view this recent pop in their unit price as a prime time to unload any remaining exposure before what I expect to be a sharp decline during 2023 as investors continue looking further ahead at a world that’s moving its energy demands elsewhere.
Notes: Unless specified otherwise, all figures in this article were taken from Alliance Resource Partners’ SEC filings, all calculated figures were performed by the author.
[ad_2]


