
An Autoregressive Distributed Lag (ARDL) model is a statistical approach used to analyze the long-term relationship between two or more variables in a time series context. It combines elements of both autoregressive (AR) and moving average (MA) models, allowing researchers to examine the dynamics and interactions between variables over an extended period.
The primary function of an ARDL model is to capture the effects of past values of variables on their current and future values while accounting for potential lags and distributed lags (lags of other variables). This makes ARDL particularly useful for investigating relationships between variables that may exhibit both short-term and long-term dependencies, especially in applied econometric research, economics, finance, and social sciences.
Forecasting stock prices using an Autoregressive Distributed Lag (ARDL) model involves several steps:
Step 1: Data Collection and Preparation
Gather historical data for the stock you want to forecast, including its daily or monthly prices, trading volume, and relevant economic indicators. Ensure the data is clean, accurate, and properly organized in a time series format.
Step 2: Variable Selection
Choose the variables you believe may influence the stock price. These can include lagged stock prices, trading volume, interest rates, inflation rates, and other relevant economic indicators.
Step 3: Order of Integration
Test the stationarity of each variable using appropriate tests like the Augmented Dickey-Fuller (ADF) test. Difference the non-stationary variables to achieve stationarity if needed.
Step 4: Lag Selection
Determine the appropriate lags for each variable by examining autocorrelation and partial autocorrelation plots. Keep in mind that the distributed lag structure is a key feature of the ARDL model, so consider including lags of other relevant variables.
Step 5: Model Estimation
Set up the ARDL model equation, which includes the dependent variable (stock price) and the selected independent variables (lagged stock prices, economic indicators, etc.). Estimate the model using appropriate software (e.g., statistical software like R or Python with libraries like statsmodels).
Step 6: Model Diagnostics
Check the model’s assumptions, such as normality of residuals, no autocorrelation in residuals, and homoscedasticity. Make necessary adjustments to the model if assumptions are violated.
Step 7: Forecasting
After ensuring the model is valid, use it to make forecasts. For short-term forecasts, input the most recent observed values of the independent variables and predict the stock price for the desired time horizon. For long-term forecasts, you can use the ARDL model equation to simulate the behavior of the variables over time.
Step 8: Model Evaluation
Compare the forecasted stock prices with the actual stock prices for a validation period.
Calculate relevant performance metrics such as Mean Absolute Error (MAE) or Root Mean Squared Error (RMSE) to assess the accuracy of the forecasts.
Step 9: Refinement and Iteration
Analyze the forecast accuracy and identify any areas for improvement.
Refine the ARDL model by adjusting variables, lags, or other model specifications based on your findings.
Following these steps, I attempted to forecast stock prices for 6 different tech and non-tech companies based on interest rates, crude oil prices, and google search trends. The 6 technology companies I selected were Apple, Google, Amazon, Microsoft, IBM, and META, all of which are the best-performing technology stocks in my portfolio. For the non-tech stocks, I once again selected a few of the best-performing non-technology stocks in my portfolio as well as a few others: Johnson & Johnson, Norwegian Cruise Line, Walmart, Target, Home Depot, and Starbucks.
Using yahoo finance and the yfinance library in python, I downloaded the monthly historical data for all of these stocks for the past 5 years. The monthly historical interest rates and crude oil prices data were downloaded from Fred, and google search trends from google analytics. Using pandas, I created one large data frame that contained the percentage change of all of the stock prices as well as the change in interest rates, crude oil prices, and google search volume.
Before running the model, I had to ensure that each variable in the data frame was stationary. Stationarity is crucial for analyzing autocorrelation, which measures the relationship between a variable and its past values. In non-stationary data, spurious autocorrelations can emerge due to underlying trends or patterns, leading to incorrect model specifications. Below are the two functions I defined that used the ADF test and the kpss test to test the stationarity of all the variables in the data frame. There is also an example of the output of the functions for Apple’s close price. The first difference was used for all of the closing prices as stock prices are volatile, and only the percentage change can give a stationary time series. When the p-value is less than 0.05, the relationship is considered to be statistically significant. However, since stocks are known to be incredibly volatile, many data scientists consider using a significance level of 0.1 instead.


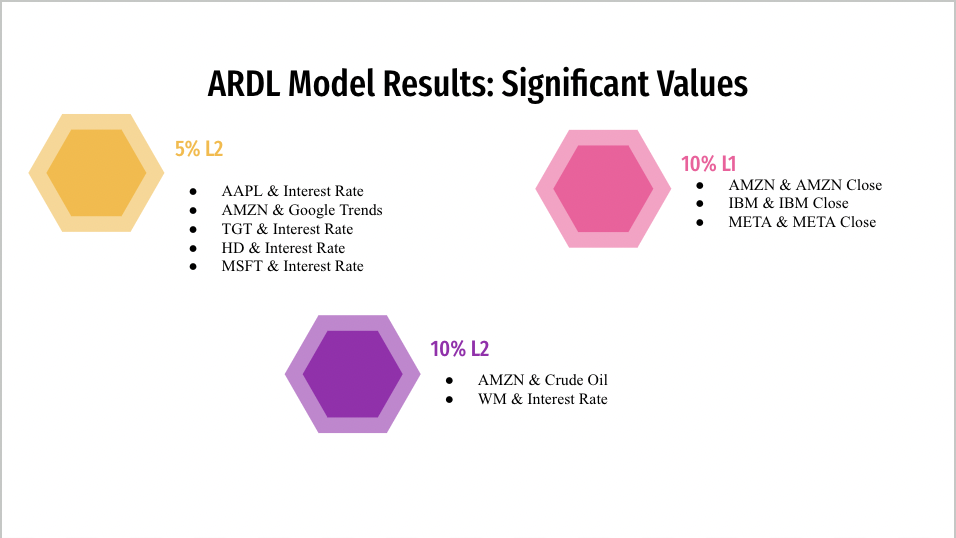
Next, using the statsmodels package in python, I defined the ARDL model and ran it for all 12 stocks. Again, the p-value was used to analyze the most significant relationships. The ARDL model table output for Apple, as well as the significant relationships found from this model, are listed below:

Following, I used the predict function off of the ARDL model to do an in-sample prediction for stock prices. The green line is the predicted values while the orange is the actual values. To visualize the accuracy of these predictions, I made a graph of the prediction errors.


It can be seen that the model was not quite accurate, but the results were still far superior to those of linear regression. Again, as there are many factors that affect stock prices, using many features is important to obtain accuracy. It is critical to find the right balance to ensure that the model is not overwhelmed but also accurate.
Finally, I used the forecast function to do an out-of-sample prediction for stock prices. I forecasted the next 10 months of stock prices for all 12 stocks. The graph of Apple with the predicted stock prices and forecasted stock prices can be seen below. The blue line is the forecasted prices for the next 10 months.

Disclaimer:
Remember that predicting stock prices involves inherent risks, and past performance is not indicative of future results. Always seek professional financial advice and conduct extensive research before making any investment choices.


