
[ad_1]

Funtap/iStock via Getty Images
Investors looking for emerging market exposure are far better placed in bonds compared to stocks. The rise in US Treasury yields and reasonably wide credit spreads mean the yield on the iShares J.P. Morgan USD Emerging Markets Bond ETF (NASDAQ:EMB) is at a multi-year-high relative to the iShares MSCI Emerging Markets ETF (EEM) Stock Price Today, Quote & News). Factoring in the lower volatility and greater diversification, there is little reason to prefer the EEM to the EMB unless investors believe in a significant China rally.
Both the EMB and EEM funds offer exposure to emerging markets, with assets under management of $15bn and $24bn, respectively. The two ETFs are closely correlated, particularly over the past two years, although the EEM has roughly double the daily volatility. The current yield to maturity on the EMB’s underlying index is 7.3%, significantly higher than the 2.9% yield on the MSCI Emerging Markets index, and the expense ratio is also 0.3 percentage points lower than the EEM’s (0.39% vs. 0.69%).
In terms of country exposure, the EMB is much more diversified, with no single country having more than a 6% weighting in the index, and holdings are highly diversified across Latin America, EMEA, and Asia. In contrast, the EEM has a huge weighting towards China and Taiwan, at 30% and 15%, respectively. The EMB has some exposure to corporates though state-owned enterprise bonds, but the vast majority of holdings are in regular sovereigns, with an average maturity of 12 years and an average credit rating of BBB. In terms of exposure to interest rates, the EMB has unsurprisingly tended to underperform during periods of rising Treasury yields, but the correlation is not particularly strong, with the EMB actually outperforming over the past few years despite surging yields.
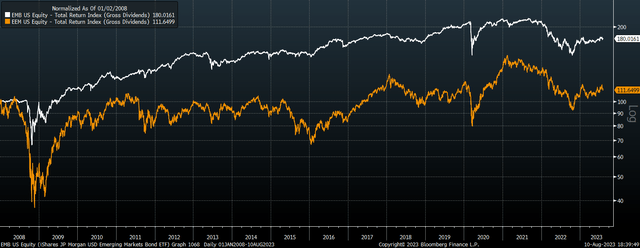
EMB Vs EEM Total Return, Rebased (Bloomberg)
Since 2007 when the EMB was launched, it has outperformed by 3.5% annually, with this outperformance coming entirely from the milder selloff seen during the global financial crisis. Since the 2008 lows, the EEM has slightly outperformed due to its higher volatility, buts Sharpe ratio has been lower. In terms of Beta to the SPX, the EEM is much higher at 0.67 over the past 12 months versus 0.43 for the EMB.
EMB To Outperform By Around 4% Annually Over Long Term
In my last article on the EMB in March (‘EMB: EM Bonds In A Sweet Spot Amid Fed Policy Reversal’) I argued that based on the relationship between the yield and subsequent returns over the past 20 years, the EMB should expect to return over 11% annually over the next 2 years. It is difficult to compare this relatively short-term outlook with that of the EEM as stocks valuations have a much looser correlation with subsequent returns over such periods.
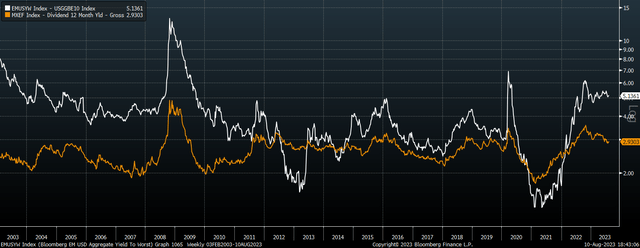
MSCI EM Dividend Yield Vs JPMorgan EM Bond Index Yield Less 10-Year Breakevens (Bloomberg)
However, from a long-term perspective, EEM returns are unlikely to come close to those of the EMB. With a dividend yield of around 2% on the EEM, dividends per share would have to grow by over 5% annually in order for the EEM to outperform the current yield to maturity on the EMB assuming no changes in valuations and allowing for losses from sovereign default. Assuming inflation over the next decade averages 2% in line with current 10-year breakeven inflation expectations, dividends would have to grow by almost 3% annually in real terms. Considering that real dividends per share have contracted by 2% annually over the past decade, and that dividends are historically elevated relative to sales and earnings, it would take a major reversal of fortunes for EM stocks to outperform. My core assumption is for the EEM to return around 7% annually over the next decade and for the EMB to return around 3%.
China Rally, The Main Risk
The main argument for owning EEM relative to EMB is that Chinese stocks are undervalued and any revaluation of the Chinese market would likely cause EEM to outperform given its huge China weighting. The chart below shows the performance of the EEM versus the MSCI China ETF and the MSCI Equally Weighted index.
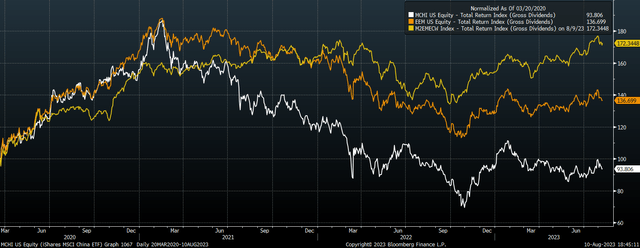
EEM, MSCI EM Equal Weight, and MSCI China (Bloomberg)
Another driver of EEM outperformance could be a commodity market rally as this would be beneficial for the resource stocks in the index and could also put further upside pressure on inflation and global bond yields. However, it would likely take a significant China bull market or further rise in bond yields for the EEM to outperform the EMB, given the huge yield differential. With the global economy looking increasingly susceptible to a recession following the recent surge in real borrowing costs, the next 12 months could easily see the EMB outperform the EMB by double digits.
[ad_2]

")
")


