
[ad_1]

Justin Paget
Flex Ltd. (NASDAQ:FLEX) provides multiple solutions for businesses. The company has achieved a margin that’s significantly above Flex’s long-term history, as the Nextracker segment proceeds to take a greater share of the company’s top line. Although the company’s organic financials seem to have quite good times ahead, I believe the growth prospects are already priced in; I have a hold rating for the stock.
The Company
Flex operates through three segments – reliability solutions, agility solutions, and Nextracker:
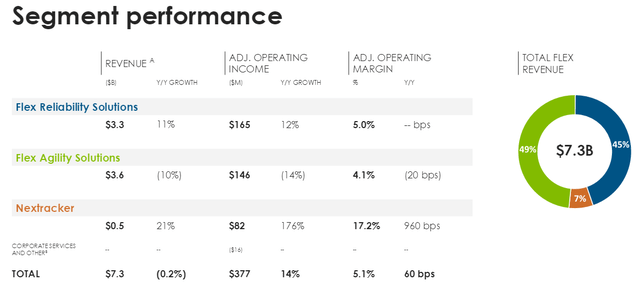
Flex’s Segments (Flex Q1/FY2024 Investor Presentation)
The Nextracker segment, a solar panel tracker company that Flex owns a part of, seems to be the best-performing asset that Flex owns, as the segment’s revenues grew by 21% on a year-over-year basis in Q1/FY2024. Combined with the highest growth, the segment has the clearly largest operating margin.
Flex’s reliability solutions and agility solutions segments have a more diversified base of offerings – the company has solutions for manufacturing, design and engineering, supply chain, regionalization, and supplemental services. The mentioned solution verticals have numerous industries in which the company’s services apply, as the serviced industries include automobile, cloud computing, consumer devices, healthcare, and industrial.
The stock has nearly doubled in the past five years, as Flex has achieved a scaling margin:
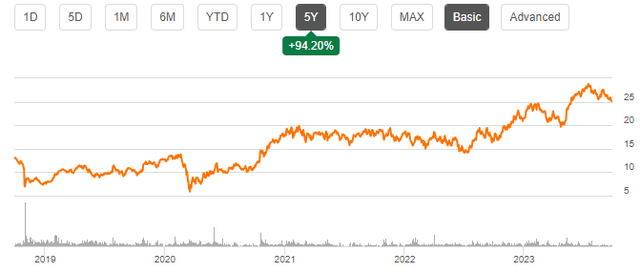
5-Year Stock Chart (Seeking Alpha)
Financials
In the company’s history, Flex has achieved a compounded annual growth of around 4.2%:
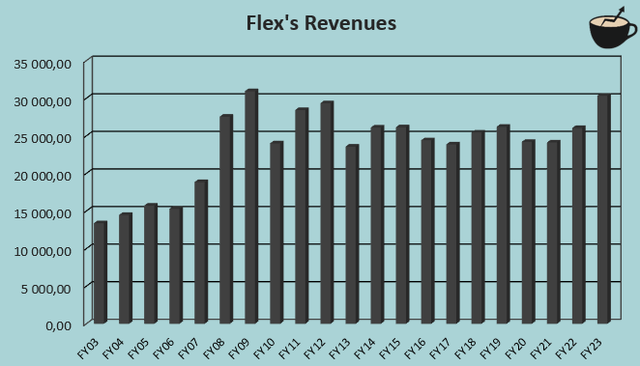
Author’s Calculation Using TIKR Data
The growth hasn’t been achieved organically in the long term though – the company’s strategy seems to have relied heavily on acquisitions in the past, as the company’s cash flow statement shows several cash acquisitions. From fiscal year 2019 forward, Flex’s pace of acquisitions has slowed down significantly, though – the company only has one significant acquisition, the buyout of Anord Mardix in 2021 for $540 million.
In the future, Flex seems to be banking on many industrial trends to fuel the company’s growth. As Nextracker’s demand seems to be increasing at a good rate with growth estimates near 20% for upcoming years, the company has at least a single segment with good future prospects. In other segments, Flex could catch growing verticals in generative AI and machine learnings, a growing EV base, and further automation globally.
Flex has had a very thin margin in the company’s history – from FY2003 to FY2023, Flex’s average EBIT margin has been 2.6%:
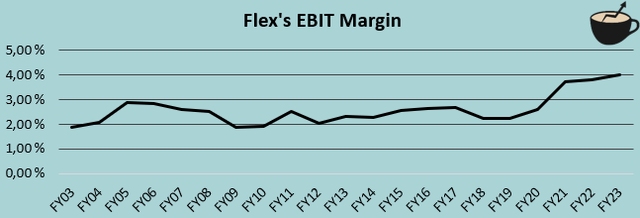
Author’s Calculation Using TIKR Data
As the Nextracker segment has taken a better foothold on Flex’s earnings, the margin has risen considerably in recent years – with trailing figures, the company’s EBIT margin stands at 4.1%.
Flex leverages a moderate amount of debt. The company’s balance sheet shows a long-term debt balance of around $3.6 billion, of which $151 million is in the current portion, to be paid off within a year’s period. Compared to the company’s market capitalization of around $11.3 billion, the amount of debt doesn’t seem unreasonable. I believe that Flex’s cash flows should be more than enough to take care of the liabilities.
Valuation
Currently Flex trades at a forward price-to-earnings ratio of 9.9, near the company’s ten-year average of 10.2:
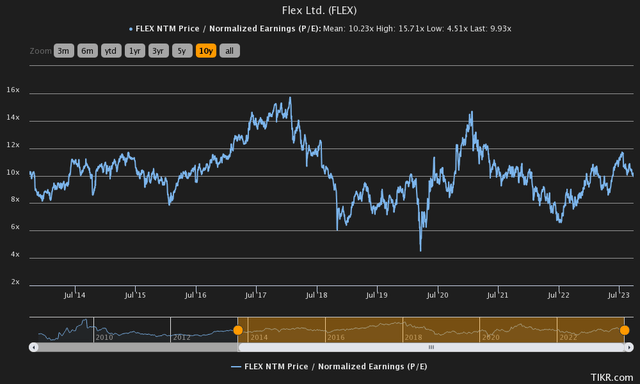
Historical Forward P/E (TIKR)
The ratio seems quite low compared to the S&P 500’s P/E of 24.4. Although the stock seems cheap on a P/E basis, I believe that a cash flow model represents a company’s valuation better; accounting earnings don’t pay the bills, cash flows do.
As usual, I constructed a discounted cash flow model to estimate a fair value for Flex’s stock. In the model, I estimate Flex to hit its current fiscal year guidance, representing a growth of 2%. Going forward, I estimate Flex’s growth to accelerate slightly as the currently soft demand subsides and the Nextracker segment continues to gain a share of the company’s total revenues – in fiscal year 2025, I estimate a growth of 6.5%. The growth slows down in sequential years into a perpetual growth rate of 2% in steps.
In Q1 of fiscal year 2024, Nextracker had an adjusted operating margin of 17.2%, compared to reliability solutions’ 5.0% and agility solutions’ 4.1%. As Nextracker continues to take share of Flex’s total revenues, I estimate the company’s EBIT margin to scale slightly – I estimate a growth of 0.8 percentage points from FY2023 to FY2033, corresponding to a growth of 20% in the margin in the period. The mentioned estimates along with a cost of capital of 11.06% craft the following DCF model scenario with an estimated fair value of $24.31, around 5% below the current price:
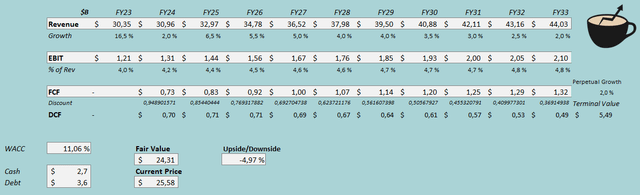
DCF Model (Author’s Calculation)
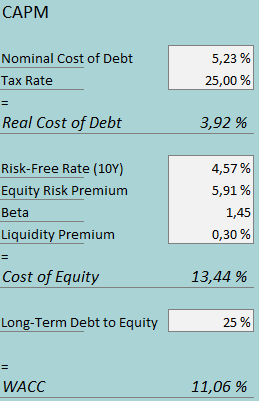
CAPM (Author’s Calculation)
In Q1/FY2024, Flex had $47 million in interest expenses. The company has around $3.6 billion of long-term debt – with the company’s amount of interest-bearing debt, Flex’s current interest rate seems to be 5.23%. Flex leverages debt on a healthy and advantageous level – I believe the company’s long-term debt-to-equity ratio is going to be around 25%, quite near the current level.
On the cost of equity side, I use the United States 10-year bond yield of 4.57% as the risk-free rate. The equity risk premium of 5.91% is Professor Aswath Damodaran’s latest estimate for the US, made in July. Yahoo Finance estimates Flex’s beta to be 1.45. Finally, I add a small liquidity premium of 0.3% into the cost of equity, crafting the figure at 13.44% and the company’s WACC at 11.06%.
Takeaway
As Flex has achieved improved profitability, the company’s earnings seem to have risen to a new level in the most recent couple of years. I believe the company has some organic growth potential through the Nextracker segment as well as some trends that operate on growing markets. At the current price, though, the future seems to be priced in as my DCF model points towards a 5% downside for the stock; I have a hold rating for the time being.
[ad_2]

")
")


