[ad_1]
NVS
Medical Properties Trust (NYSE:MPW) is a REIT that’s a fallen angel. The reason I refer to it as a fallen angel is that at one point MPW and many similar net lease commercial REITs were seen as the holy grail of yield investing, in that investors believed that they would pay out consistently growing distributions for perpetuity and that investors would simply need to buy and hold them with a DRIP on it. Tail risk events like a pandemic and the fastest rate hikes since the early 1980s have of course broken that view.
As an investor who is deep-value-oriented, I look to fallen angels to find “cheap” assets that are trading for well below intrinsic value, but at the same time, most of these assets are trading cheap for a reason, and hence are value traps. I would put MPW in that category.
MPW is down around 77% from its highs but I believe that it has lower to go.
There are a few key areas that I want to touch upon in this write-up:
1. Debt schedule and what rates will the bonds be refinanced at
2. The true book value of the REIT if they needed to liquidate assets
3. Concentration on higher-risk tenants
4. Valuation and why it’s not as cheap as it seems
Debt
Below is the debt schedule:
Debt Maturities (Medical Properties Trust)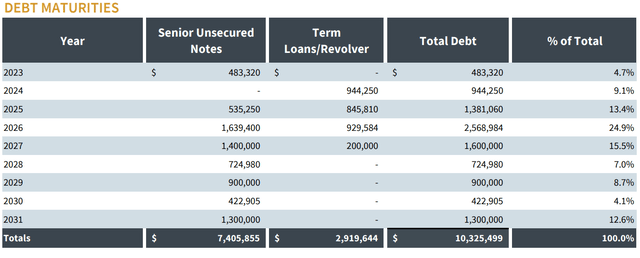
Source
Below is the debt summary:
Debt Summary (Medical Properties Trust)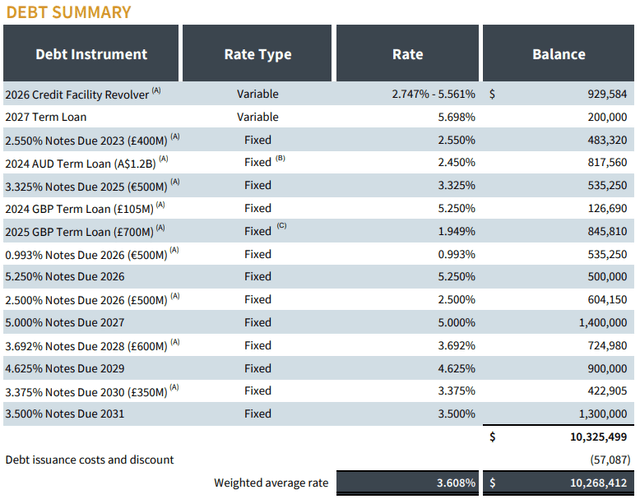
Source
With the current weighted average rate (3.608%), the cost of capital as a dollar amount is $372,544,003.92.
What we can do to recalculate the cost of capital is to use a higher rate that these notes would likely get refinanced into. To get that rate we can look at what yield to maturity MPW’s bonds are currently trading at.
Bond Super Mart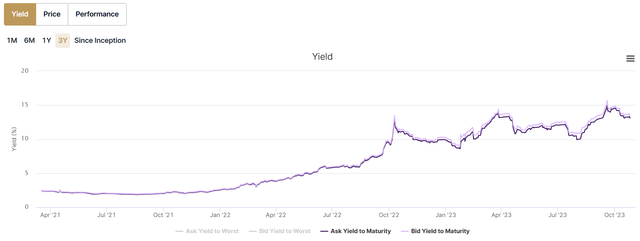
Source
Above is the YTM of the 2026 note. The current YTM is around 13.5%. I chose the 2026 note as that is the year with the most amount of debt maturing, hence there is a large maturity wall there; also, many commercial REITs took out mortgages with a 5-year balloon in 2021, so if there were to be a large default across the commercial real estate sector it would likely happen in 2026.
A 13.5% yield on the total debt of MPW would make for $1,393,942,365 per year in interest expense. We can compare this to the FFO plus interest expense.
Below is the FFO for MPW:
Medical Properties Trust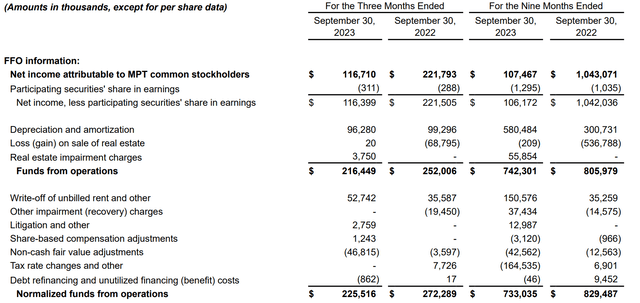
Source
We can start by annualizing last quarter’s FFO of $216,449,000, which gets us to $865,796,000.
When looking at their income statement we can see that interest expense for the most recent quarter was $106,709,000:
Medical Properties Trust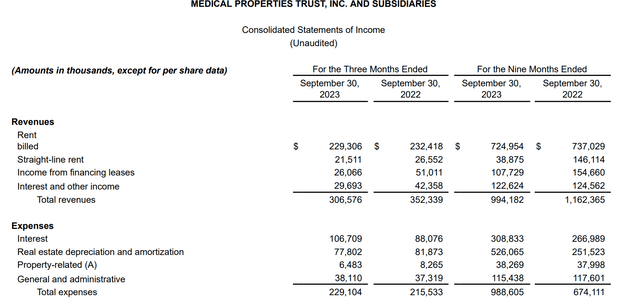
Source
Annualizing this interest expense makes it $426,836,000. If we add this to the annualized FFO ($426,836,000+$865,796,000) we get $1,292,632,000 as the FFO + interest expense.
Since we calculated interest expense at current market rates to be $1,393,942,365, which is higher than $1,292,632,000, this effectively ensures that the current market rate puts the company at below breakeven FFO. So the focus right now should be on how to reduce the debt as it’s a fight against time.
Debt Reduction Through Asset Sales
Since MPW is structured as a REIT it has a mandate to distribute 90% of its taxable income. This means that unlike a corporation it can’t just retain all its earnings and use that to buy back debt. And even if MPW were to be converted to a corporation, thereby removing distributions, then income investors who buy this just for the distributions would likely sell. In my view, the only choice that MPW has to reduce debt (in this higher-rate environment) is to sell off properties.
The main issue is that we don’t know what the true value of MPW’s properties is from just looking at the balance sheet since the asset values listed are at the cost acquired minus depreciation.
To get to a rough value of what the real estate would sell for we would need to put ourselves in the shoes of a financial buyer, like a PE fund, who could be a potential buyer for these assets. The easiest way to put ourselves in the shoes of a financial buyer is to value the real estate from a cap rate perspective. We should start by finding what the adjusted EBITDA is from a buyer’s perspective.
Last quarter’s FFO was $216.4mm. I’m starting with FFO since it already adds back depreciation, amortization, gain/loss on assets, and interest income. We can annualize this to $865.6mm.
From there we would need to add back the interest expense:
Medical Properties Trust
Source
I used the most recent 10-Q to find interest expense since Seeking Alpha only has net interest expense. Interest expense in the most recent quarter was $104.470mm, which annualized is $417.880mm.
This makes for an adjusted EBITDA from the buyer’s perspective of $1,283.48bn.
Then we get to the hard part which is the cap rate we want to use. Normally the cap rate will equal the WACC of the buyer. The first piece of calculating WACC is the cost of debt capital. This will vary widely depending on the buyer. Normally the current yield to maturity on a company’s bonds will give a good overview of what the cost of debt capital would be, but in this case, that yield is likely too high due to the distressed nature of MPW. There aren’t a lot of stats on the market for what private-label CMBS is yielding; the closest one can get is on Stack Source which is the only daily updated source of commercial mortgage rates. Here’s what they say the current rates are:
Stack Source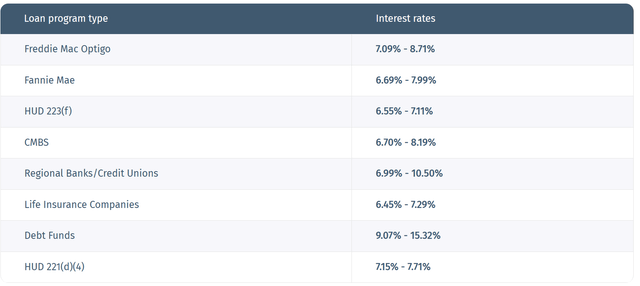
Source
Based on this information the average CMBS is around 7.5%. There is a spread between what an investor gets on CMBS and what the borrower pays which is how the issuer profits, so it’s likely a borrower will pay around 8.5%. 8.5% is also in line with the current WSJ Prime Rate.
Commercial debt funds are known for working with less creditworthy borrowers with higher leverage (usually through mezzanine debt), so their rates are averaging in the low teens.
At the very bottom of the capital stack, there’s equity. Historically, PE firms have made 11% CAGR net of fees from 2000 to 2021, but that was an environment with both low rates and the lost decade(2000-2010) where returns were abysmal. If we look over a longer period as shown in the chart below, the median IRR that PE funds generated in the 80s and 90s was 15%-20%:
Private Equity Returns (WSJ)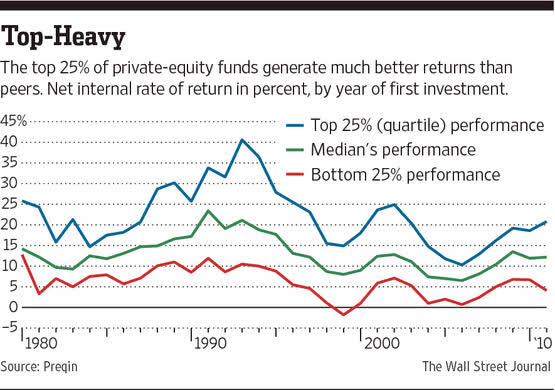
Source
Seeing as though it’s now possible to make returns that are in the double digits with CLOs and publicly traded REITs (due to current rates being the highest in this century), investors are likely to expect something closer to a 20% return net of fees. PE funds usually work on a 2 and 20 fee structure whereas private REITs will normally have a 2% management fee, but rather than carried interest they will instead have a load (upfront fee) on the fund. For simplicity of calculations, we’ll just use a 2% management fee with no carry or load. This means that gross equity returns need to be 22%.
We can then use a traditional commercial real estate capital stack (as shown below) to find the WACC.
Yield Street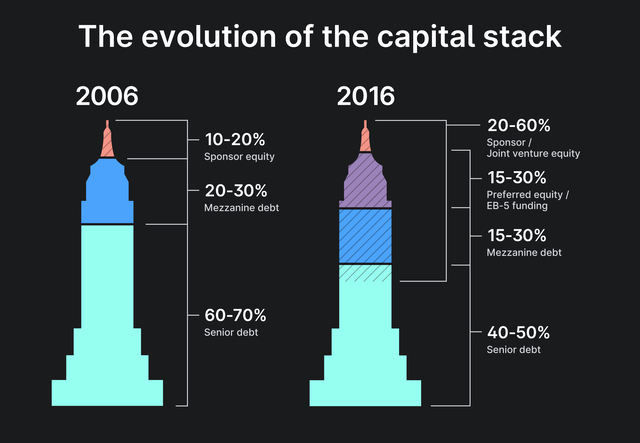
Source
The capital stack shown on the left from 2006 is the “old school” way that most private REITs and PE funds would look to do an LBO of commercial real estate and I’ll work with that for this WACC calculation.
Capital Stack Split:
60% Senior Debt – Cost of Capital: 8.5%
20% Mezzanine Debt – Cost of Capital: 14%
20% Equity – Return Expectations: 22%
WACC = (60%*8.5%) + (20%*14%) + (20%*22%) = 12.3%
WACC = Cap Rate = 12.3%
The inverse of a 12.3% cap rate is an 8.13x NOI multiple.
Earlier we’d calculated an adjusted EBITDA of $1,283.48bn; if we multiply the NOI multiplier, we get a value of $10,434.8bn. This is what I would approximate the fair market value of the real estate to be.
Keep in mind that this is the fair market value. When selling real estate or any asset that doesn’t have a liquid market there are frictional costs, which increase the quicker an asset needs to be liquidated. This is where orderly liquidation and forced liquidation value come into play. If MPW needs to quickly liquidate assets they would likely be sold for orderly or forced liquidation value, which would be significantly below fair market value.
The value I calculated is below the $11.727bn of total real estate assets listed in the balance sheet. Also, the total liabilities on the balance sheet are $10.7195bn, which is close to what I valued the total real estate at; with that said, because rates have gone up the current market value of MPW’s bonds are lower than what listed on the balance sheet, so the company could do asset sales and buyback debt. This leaves some equity left over, but the amount of “true” equity that I believe the company has is far lower than what the book value shows.
Debt Covenants
I’ve seen very few articles on Seeking Alpha discussing the debt covenants on MPW’s debt. A few weeks back Julian Lin wrote an article that discussed this issue, which is how I initially became aware of it.
Below is a direct quote from MPW’s 2027 bond prospectus:
(1) The Issuers will not and will not permit any of the Restricted Subsidiaries to Incur any Indebtedness (including Acquired Indebtedness) if, immediately after giving effect to the Incurrence of such additional Indebtedness and the receipt and application of the proceeds therefrom, the aggregate principal amount of all outstanding Indebtedness of the Issuers and the Restricted Subsidiaries on a consolidated basis would be greater than 60% of consolidated Adjusted Total Assets of the Issuers and the Restricted Subsidiaries.
This means that debt can’t get above $11.4bn as that is 60% of total assets. Currently, total liabilities stand at $10.7195bn.
Although MPW is unlikely to get into more debt, the bigger risk I see is that they might sell assets for less than what their cost basis is, which leads to assets going down faster than liabilities getting paid off, hence the covenant could be hit.
Cutting The Flowers and Watering the Weeds
When it comes to asset sales and covenants, I’d be worried about what many investors refer to as cutting the flowers and watering the weeds. This is a phrase used by many portfolio managers who say to avoid rebalancing which leads to cutting winners and adding to losers. When I use it in the context of MPW (and other REITs in a similar predicament) I mean that when the company is doing asset sales they risk selling the highest quality properties and keeping lower quality properties.
This often seems like a rational decision in the short term but can lead to longer-term issues. For example, if you managed a REIT and needed to quickly reduce debt by buying back bonds, you would likely sell the properties with the lowest cap rates rather than the highest cap rates. The issue is that the properties with the lowest cap rates are also the highest quality.
A great example of this is the four facilities in Australia that were sold just a few weeks back. They were sold for a 5.7% cap rate. While this might seem great since MPW can sell its properties for 5.7% and buy back debt at a higher rate, it also brings in more risk. The facilities sold in Australia were of higher quality as they didn’t have the same tenant issues that the American properties have; the two main American tenants are Stewart Health Care and Prospect Medical, both of whom have had issues paying their leases. So by selling the higher quality facilities, MPW has more concentration risk to lower quality facilities, hence cutting the flowers and watering the weeds.
Valuation
I’ve seen many contributors acknowledge that there are many issues like the ones I’ve pointed out above, but they will mention in their articles that the valuation is cheap so it can justify many of the issues.
Even though the P/FFO is 3.1 the valuation isn’t as cheap as it seems. For reference, the EV/EBITDA is 14.03, which is still quite high.
EV/EBITDA (Seeking Alpha)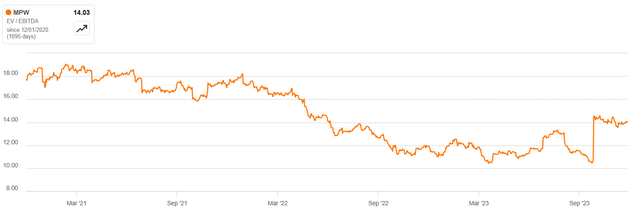
Source
Below is the P/CF:
P/CF (Seeking Alpha)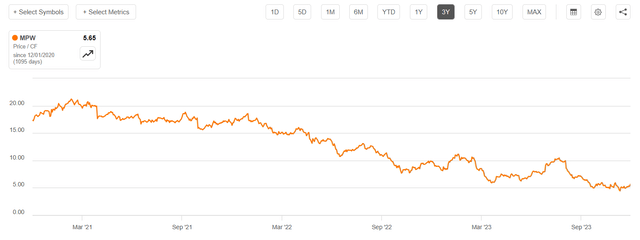
Source
As can be seen, the P/CF is also low like the P/FFO.
The reason for this big difference between EV/EBITDA versus P/FFO & P/CF is leverage.
This difference can be illustrated by comparing the same company with two different leverage profiles; for instance, a company with no debt could trade for 10x EBITDA, while another company with 8 turns of debt could trade for 2x EBITDA. While on the surface it seems like the company going for 2x EBITDA is going for a lower valuation, it’s not. When looked at from an enterprise value perspective (unleveraged view) both are going for 10x EBITDA, but the ladder simply has a debt-heavy capital stack.
On a quick side note, I do some advisory work in the lower middle market M&A space and incidentally, I see this all the time. To illustrate, I’ll see deals where the seller is selling their company for 3.5x EV/EBIT. A financial buyer will buy the company with 3x EBIT of debt and only 0.5x EBIT of equity. With a cost of debt capital of 10%, the pre-tax ROIC of the acquirer is 160%. Whereas if the acquirer bought the company with no debt the ROIC is only 28.57%. We even have a term for this in the LBO space called financial engineering, whereby nothing fundamentally changes with the company being acquired, but investors’ IRR can be drastically boosted by adding layers of low-cost debt.
All in all, my view is that the valuation for MPW isn’t cheap when looked at from an unleveraged perspective, but it simply looks cheap due to the high debt load.
The Bottom Line
With rates where they are MPW will be cash flow negative when it needs to refinance debt. The only way to avoid this is to sell off assets. The issues here are two-fold: firstly properties are likely worth far less than what they are listed on the balance sheet for, and secondly, in a bid to reduce debt quickly and avoid tripping convents MPW is likely to sell higher quality assets first leaving the firm with low quality-high risk properties. Also, unlike what many market participants believe the valuation is still very pricey at 14.03x EBITDA.
[ad_2]
Source link


