
[ad_1]

seraficus
This article series aims at evaluating ETFs (exchange-traded funds) regarding past performance and portfolio metrics. Reviews with updated data are posted when necessary.
PCEF strategy and portfolio
Invesco CEF Income Composite ETF (NYSEARCA:PCEF) is a fund of funds that started investing operations on 02/19/2010 and tracks the S-Network Composite Closed-End Fund Index. It has 114 holdings and a 12-month distribution yield of 9.97%. Distributions are paid monthly. The total expense ratio is 1.99%: 0.50% in ETF management fees, plus 1.49% in held fund expenses.
Eligible funds are screened on several factors. In particular, premium to net asset value must be under 20%. Weights are based on net asset value and adjusted to favor funds with a discount and penalize those with a premium. Each constituent’s weight is capped at 8%. The top 10 holdings, listed below with yields and discounts, represent 28.7% of asset value.
Ticker
Name
% Weight
% Yield
% Discount to NAV
EXG
Eaton Vance Tax-Managed Global Diversified
4.00
8.49
9.49
BIGZ
BlackRock Innovation and Growth Term Trust
3.84
10.70
14.67
BMEZ
BlackRock Health Sciences Term Trust
3.62
11.11
14.24
BSTZ
BlackRock Science & Technology Term Trust
3.02
10.78
15.77
ECAT
BlackRock ESG Capital Allocation Term
3.01
9.66
12.32
NFJ
Virtus AllianzGI Dividend, Interest & Pre
2.52
7.85
13.26
JPS
Nuveen Preferred & Income Securities Fund
2.49
7.16
13.57
HYT
BlackRock Corporate High Yield Fund, Inc.
2.17
10.07
1.38
ETY
Eaton Vance Tax-Managed Diversified Equity
2.13
7.94
2.48
EVV
Eaton Vance Limited Duration Income Fund
1.88
10.10
10.63
Click to enlarge
Source: Invesco, Portfolio123, CEFconnect
Closed-end funds are often chosen by investors for their distribution yield. They also have a few metrics that are not applicable to stocks and ETFs. Two of them are more important than the yield:
Discount to NAV (higher is better).
Relative discount = Discount to NAV minus its 12-month average (higher is better).
The next table compares PCEF holdings with the full CEF universe regarding these metrics. Out of 112 funds in the portfolio, 105 with available data have been taken into account in the calculation.
Average discount %
Average relative discount %
PCEF
7.67
1.00
CEF universe
10.25
1.33
Click to enlarge
Calculation using Portfolio123
The constituent averages are inferior to the CEF universe averages.
Performance
The next chart compares total returns of PCEF and two other ETFs of CEFs:
Amplify High Income ETF (YYY) Saba Closed-End Funds ETF (CEFS)
The chart starts on 3/27/2017 to match inception dates. PCEF beats YYY, but CEFS is the best performer by a significant margin.
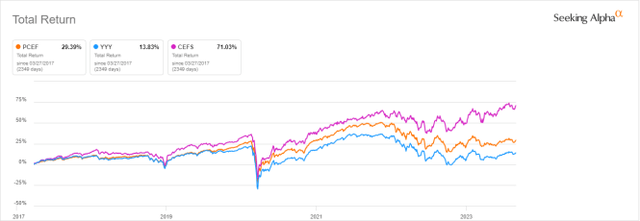
PCEF vs YYY, CEFS since 3/27/2017 (Seeking Alpha)
In the last 12 months, CEFS has outperformed PCEF by almost 10%.
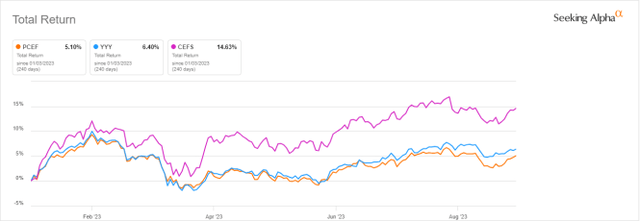
PCEF vs YYY, CEFS year-to-date (Seeking Alpha)
The next table compares PCEF since inception (February 2010) with U.S. large-cap equities (SPY), the total U.S. bond market (BND) and a 60/40 mix. Dividends are reinvested to calculate the total return.
Total Return
Annual Return
Drawdown
Sharpe ratio
Volatility
PCEF
103.17%
5.39%
-38.64%
0.41
11.88%
SPY
420.55%
12.99%
-33.72%
0.83
14.78%
BND
27.87%
1.84%
-18.58%
0.27
4.19%
60% SPY 40% BND
213.25%
8.82%
-21.80%
0.85
9.29%
Click to enlarge
Data calculated with Portfolio123
In fact, SPY, BND or even a 60/40 mix are not appropriate benchmarks for PCEF. I will suggest a better one. The next table compares PCEF since inception with a subset of the closed-end fund universe: The 100 CEFs with higher yields among those with an average trading volume above $100,000 per day and a positive discount to net asset value. To make it comparable with a passive index, the subset is reconstituted in equal weights every quarter.
Total Return
Annual Return
Drawdown
Sharpe ratio
Volatility
PCEF
103.17%
5.39%
-38.64%
0.41
11.88%
Reference subset
133.04%
6.46%
-48.16%
0.42
15.36%
Click to enlarge
Past performance is not a guarantee of future returns. Data Source: Portfolio123
This benchmark, much simpler than PCEF underlying index, beats it by 30% in total return. However, it shows a higher risk in drawdown and volatility. A note of caution: The fund’s return is real, whereas the subset is simulated.
As reported on the next chart, the share price has lost almost 30% since inception. The cumulative inflation at the same time has been about 40% (based on CPI), resulting in a loss of 58% in inflation-adjusted value (the formula is 1-0.7*0.6).
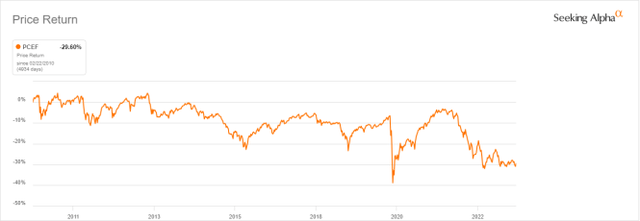
PCEF share price history (Seeking Alpha)
The next chart shows the annual sum of distributions has lost almost 13% between 2012 and 2022. In the same period, the cumulative inflation has been about 30%. The fund has suffered a decay not only in value but also in income stream.
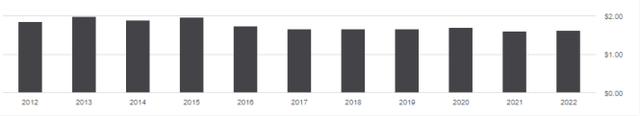
PCEF distribution history (Seeking Alpha)
Takeaway
Invesco CEF Income Composite ETF implements a systematic, rules-based strategy to invest in closed-end funds. Its total expense ratio is about 2%, and valuation metrics of constituents aren’t very attractive. PCEF has lagged its competitor CEFS since the latter’s inception. Moreover, price and distribution have been on a downtrend for years, and inflation makes it worse. Based on historical data and current characteristics, I don’t think PCEF is a good long-term investment to preserve income and capital, but it may be useful for tactical allocation and swing trading.
Bonus: How to deal with decay in high-yield funds
Capital and income decay is an issue in many closed-end funds, like in high yield ETFs. However, it may be avoided or mitigated by rotational strategies. I designed a 5-factor ranking system in 2016, and monitored its performance during several years. I started publishing the eight best ranked CEFs in Quantitative Risk & Value (QRV) after the March 2020 meltdown. The list is updated every week. It isn’t a model portfolio: Trading the list every week is too costly in spreads and slippage. Its purpose is helping investors find funds with a good entry point. In the table below, I give the hypothetical example of starting a portfolio on 3/25/2020 with my initial “Best 8 Ranked CEFs” list and updating it every 3 months, ignoring intermediate updates. Return is calculated with holdings in equal weight and reinvesting dividends at the beginning of every 3-month period.
Since 3/25/2020
Total Return
Annual Return
Drawdown
Sharpe ratio
Volatility
Best 8 CEFs quarterly
134.62%
28.10%
-20.60%
1.22
19.52%
PCEF
41.19%
10.53%
-25.14%
0.53
15.28%
SPY
92.10%
20.87%
-24.50%
0.98
18.29%
Click to enlarge
This simulation is not a real portfolio and not a guarantee of future return
Of course, past performance (real or simulated) is not representative of future return. However, I think a time-tested rotational strategy in CEFs has a much better chance to protect both capital and income stream against erosion and inflation than a high-yield ETF.
[ad_2]

")
")


