[ad_1]
Funtay
In 2022, Tourmaline (OTCPK:TRMLF) generated a record free cash flow of CAD$3.2 billion and paid dividends of CAD$7.90 per share on base and special dividends. Tourmaline’s total dividends paid increased from CAD$469 million in 2021 to CAD$2653 million in 2022. Due to the hiked natural gas and oil prices in 2022, Tourmaline’s financial results were very strong and with the current energy prices, we cannot expect the company’s 2023 results to be as strong as in 2022. However, even with current energy prices, Tourmaline can remain highly profitable, reward its shareholders, cover its obligations, and increase its production. The company expects its operating cash flow, free cash flow, and capital expenditures in 2023 to be CAD$3.8 billion, CAD$2.0 billion, and CAD$1.7 billion, respectively. It is important to know that due to entering into a 15-year natural gas supply agreement (to deliver approximately 140 million cubic feet per day) in July 2021, Tourmaline began delivering gas to the US Gulf Coast with full exposure to Japan Korea Marker (JKM) pricing in January 2023. Based on its current production volumes, recent developments and acquisitions, and natural gas & oil spot and futures prices, Tourmaline’s expectations are reliable. The stock is a buy.
Financial results
In its fourth quarter and full-year 2022 financial results, Tourmaline reported 2022 commodity sales from production of CAD$8.1 billion, compared with CAD$5.1 billion in 2021, as the natural gas and crude oil prices hiked. The company’s income from operations increased from CAD$2.6 billion in 2021 to CAD$6.0 billion in 2022, up 131% YoY. Tourmaline’s total produced volume increased from 484 thousand boe/d in 2021 (78% natural gas) to 508 thousand boe/d in 2022 (77% natural gas). The company was able to increase its production level by 5% in 2022 as a result of its corporate and property acquisitions completed in the last two years, which accounts for 25% of the increase in 2022. In the last two years, Tourmaline had a significant acquisition activity by paying CAD$1.6 billion in cash and common shares, which was expected to increase its production by about 70 thousand boe/d.
“The remaining increase is attributable to the company’s successful exploration and production program, including the growth in condensate and NGL production which reflects the continued development of the Gundy area and the commissioning of Gundy Phase 2 in January 2022,” the company explained.
Tourmaline paid a special dividend of $CAD2.00 per share on 1 February 2023 and paid a quarterly cash dividend of CAD$0.25 per common share in 1Q 2023. In 4Q 2022, Tourmaline paid a quarterly dividend and a special dividend of CAD$0.25 per share and CAD$2.25 per share, respectively. Also, in 1Q 2022, the company paid a quarterly dividend and a special dividend of CAD$0.20 per share and CAD$0.125 per share, respectively. The company plans to return 50-90% of its free cash flow to shareholders in 2023.
The market outlook
Tourmaline estimates its 1Q 2023 total production to be between 520 to 530 thousand boe/d, and expects its full-year 2023 production to be 520 to 540 thousand boe/d, which is higher than in 2022 and 2021. It is worth noting that Tourmaline expects to drill and complete a total of approximately 300 wells (gross) in 2023. Figure 1 shows Tourmaline’s exploration and production (EP) growth plan, which indicates the company expects its production to increase to 700 thousand boe/d in 2028. Based on strip prices on 15 February 2023 and the company’s EP growth plan, Tourmaline’s after-tax cash flow and free cash flow in 2023 are expected to be CAD$3835 million and CAD$1975 million, respectively. Figure 2 shows strip prices as of 15 February 2023. Due to very mild temperatures during the last winter, natural gas prices in 2023 were significantly lower than in 2022, as consumption decreased and natural gas production and storage increased. According to EIA, cumulative net withdrawals of natural gas from the week ending 4 November 2022 to the week ending 17 March 2023 have set a record low (through the 20th Weekly Natural Gas Storage Report) in the last winter (see Figure 3).
Figure 1 – Tourmaline’s exploration and production growth plan
March 2023 presentation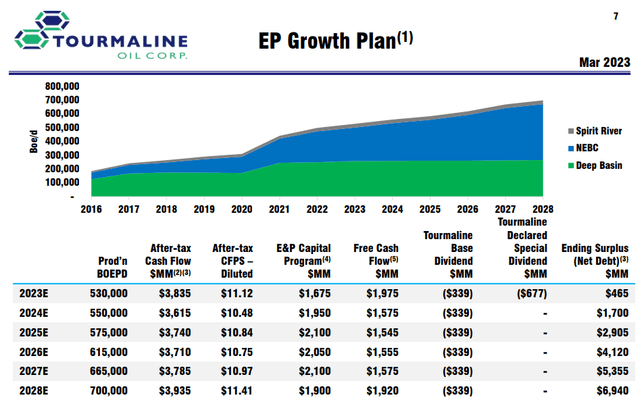
Figure 2 – Strip pricing as of 15 February 2023
Author (based on March 2023 presentation data)
Figure 3 – Cumulative net withdrawals of natural gas
eia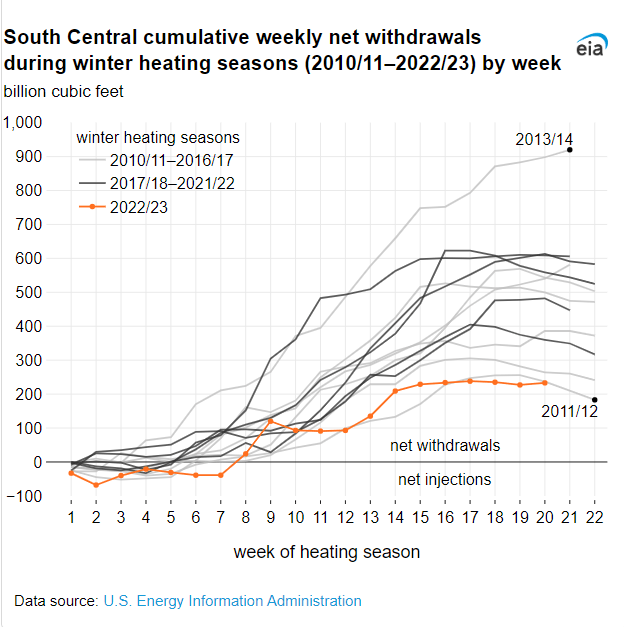
In Figure 4, we can see that Henry Hub’s natural gas spot price increased in the second half of February, then decreased in the second half of March. Henry Hub natural gas spot price is now lower than on 15 February. Furthermore, Figure 3 indicates that natural gas futures (NYMEX) increased in the second half of February, then decreased. As of 28 March 2023, natural gas futures (NYMEX) were lower than on 15 February 2023. According to EIA’s natural gas weekly update, in the week ending 29 March 2023, the price of the 12-month strip averaging May 2023 through April 2024 futures contracts declined 5 cents to $3.083/MMBtu.
Furthermore, Figure 5 shows that JKM prices decreased in the past month. According to EIA’s short-term energy outlook, Henry Hub’s natural gas price in 2Q 2022 is expected to be $2.87 per thousand cubic feet, then increase in the second half of the year, as countries start getting ready for the winter season (see Figure 6). It is important to know that Tourmaline has a total storage capacity of 4.0 billion cubic feet which allows for the opportunity to inject in periods of lower commodity prices and withdraw in periods of higher prices. As a result of higher prices and higher production, I expect Tourmaline’s natural gas sales to increase in the second half of 2023, reaching its estimated cash flow and free cash flow by the end of the year. Also, WTI crude oil price decreased to $67 per barrel on 17 March; however, increased in the past two weeks. On one hand, the high global oil inventories and economic headwinds in the United States and Europe, prevent oil prices from increasing. On the other hand, high demand for refineries, ongoing geopolitical tensions in Europe, and the reopening of China support crude oil prices. The WTI crude oil average quarterly price is expected to remain between $75 to $78 per barrel in the second, third, and fourth quarters of 2023.
Figure 4 – Natural gas spot and futures prices (NYMEX)
Author (based on EIA’s data)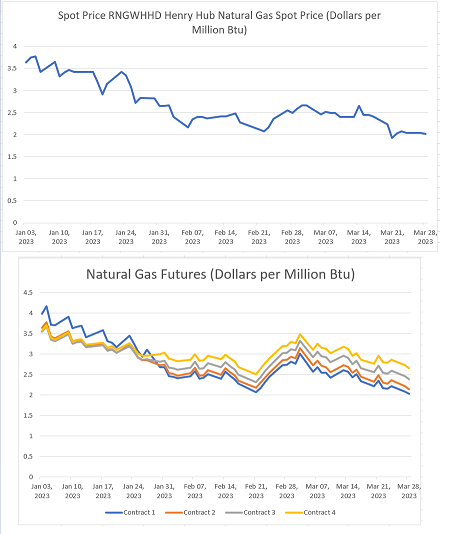
Figure 5 – LNG Japan/Korea Marker (platts) swap
www.reuters.com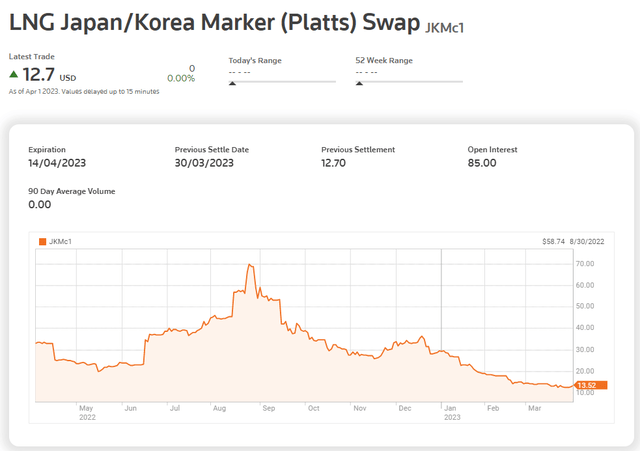
Figure 6 – Energy prices
eia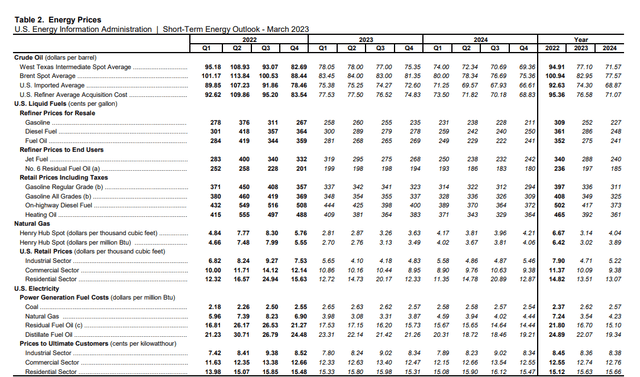
TRMLF performance outlook
*** In this section, data are gathered from Seeking Alpha and are presented in USD
I conducted an analysis of the company’s free cash flow trend over recent years. It was not surprising to find that the company had a promising level of FCF, given that they generated a substantial amount of operating cash in 2022. A surge in their cash operation from $2.25 billion in 2021 to $3.4 billion in 2022, coupled with an 8% decrease in capital expenditure from $1.56 billion in 2021 to $1.44 billion, resulted in a boost in free cash flow to over $2 billion by the end of 2022. Tourmaline had the largest share of FCF at 74% in 2022 compared to previous years. The significant amount of free cash flow is indicative of the company’s ability to pay off debt, repurchase stock, and foster business growth. Also, in 2023 guidance, the company anticipated generating $3.8 billion and $2.0 billion cash flow and free cash flow, respectively, which the majority of the free cash flow will be returned to shareholders by dividends (see Figure 7).
Figure 7 – TRMLF’s free cash flow (in millions)
Author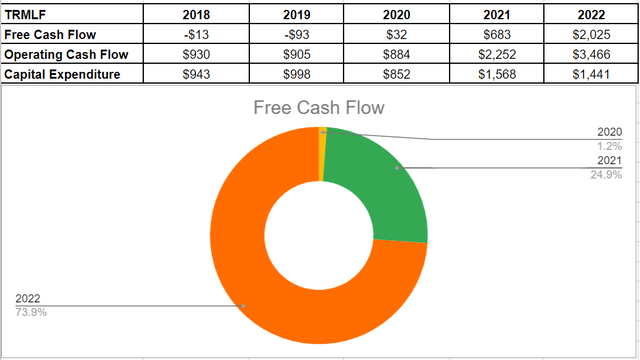
Additionally, I looked at Tourmaline’s profitability ratios to assess how well the company can turn a profit and use its assets to make money for its investors. I have examined the profitability ratios for margin and return ratios to provide useful insights into the financial health of the company. I calculated the ratios in comparison to recent years to be more helpful.
In general, margin ratios evaluate the ability of the company to turn revenues into profits in a number of ways. It is indicatable that the company had stronger gross profit, EBITDA, and net profit margins compared with the previous years. In minutiae, the total revenue of Tourmaline increased considerably by 39%, from $3.7 billion in 2021 to $5.2 billion in 2022. A jump in revenue combined with the higher level of profits and EBITDA led to higher margin ratios at the end of 2022.
TRMLF’s gross profit margin was 72% in 2021, which is slightly lower than its amount of 75% at the end of 2022. Also, the company’s EBITDA margin was 59% in 2021, which is far lower compared with its amount of 71% in 2022. Moreover, Tourmaline’s net profit margin, which is a final picture of how profitable the company is after all expenses, improved considerably to 63% in 2022 versus its previous amount of 42.5% at the end of 2021. As a result, the stronger margin ratios are proof of the company’s capability to generate profit for its investors (see Figure 8).
Figure 8 – TRMLF’s margin ratios
Author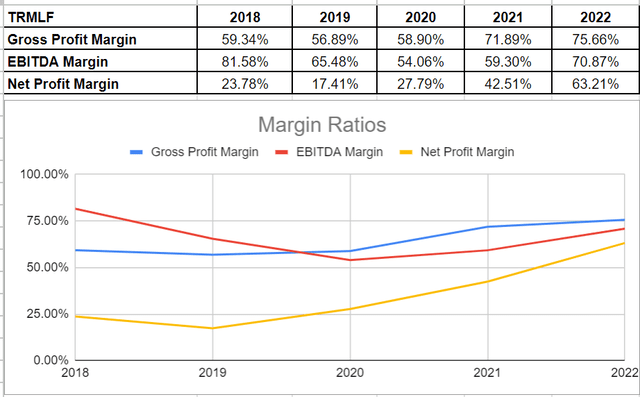
Furthermore, I looked into TRMLF’s return on equity and return on assets ratios to show how well the company can tailor returns to its shareholders. The ROA ratio illustrates the amount of profit a company may produce for each dollar of its assets. The ROA ratio of 13.25% for Tourmaline in 2021 surged by 1050 bps compared with its level of 23.75% at the end of 2022. Additionally, its return on equity of 32.78% in 2022 is far higher than 17.46% in 2021. ROE ratio shows the company’s net income concerning shareholders’ equity and is important since it calculates the rate of return on the capital invested in the business. The company’s net income of $1.6 billion in 2021 was boosted to $3.3 billion in 2022 and thus affected its return ratios (see Figure 9).
Figure 9 – TRMLF’s return ratios
Author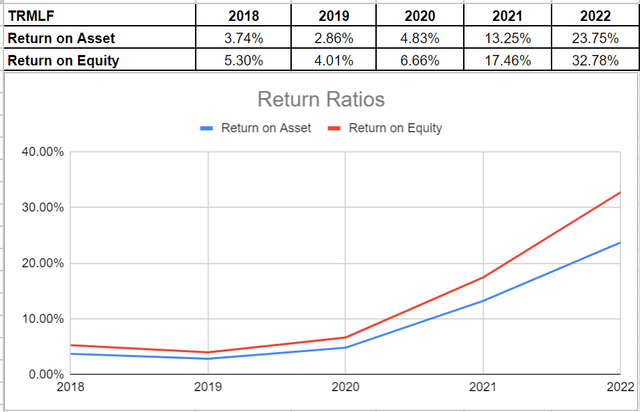
Summary
Tourmaline benefited from hiked energy prices in 2022 and was able to improve its financial ratios. TRMLF’s return on assets and return on equity improved to over 23% and 32% in 2022, respectively. The company’s natural gas production is increasing and despite lower energy prices in 2023, Tourmaline is on the right path. TRMLF stock is a buy.
Editor’s Note: This article discusses one or more securities that do not trade on a major U.S. exchange. Please be aware of the risks associated with these stocks.
[ad_2]


