
[ad_1]

cemagraphics
The S&P500 made its largest weekly decline since March this week as the contracting pattern broke out. This was fully prepared for in last week’s article which called for “a burst of volatility (FOMC meeting induced?)” and a test of 4335.
Next week will be very interesting. The final part of the scenario laid out in my last report was a capitulation below 4325-35 support followed by a reversal from the 4300 area; a bear trap which should lead to a solid bottom. This is still my base case.
However, the S&P500 has developed a very dangerous pattern with acceleration lower into a weak Friday close below support. This is how a crash (or at least a large drop with >5% down days) often sets up.
Let me be clear: I am not calling a crash. Nevertheless, I must point out we now have the conditions where a crash gets much more likely. I will go into more details later, but needless to say I had no urge to buy on Friday and would need to see risks mitigate before I consider longs.
To help set context at this dangerous time, a variety of tried and tested technical analysis techniques will be applied to the S&P 500 in multiple timeframes. The aim is to provide an actionable guide with directional bias, important levels, and expectations for price action. The evidence will then be compiled and used to make a call for the week(s) ahead.
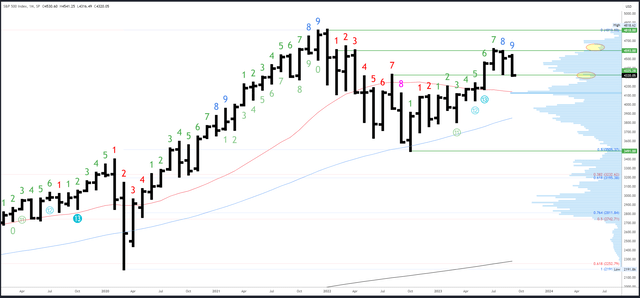
S&P 500 Monthly
The Q3 and the September bar will close on Friday. This is similar to Q2 which also closed on a Friday and underwent a strong “window dressing” rally to close out the quarter. Will there be another to save a bearish close?
I think there’s a good chance, but much depends on what happens earlier in the week. If the price action is still weak and below 4300 on Thursday, the likely move is lower into a bearish close; the opposite of “window dressing.”
While the monthly chart would take a bearish turn with a close below 4325, seasonality improves in October and the October bar could flip the view back bullish as soon as it re-takes 4325-35.
SPX Monthly (Tradingview)
Monthly resistance is 4593-4607. 4637 is the next level above, then the all-time high of 4818.
4325-35 is significant support followed by 4195-4200, then 4140.
The September bar is number 9 (of a possible 9) in a Demark upside exhaustion count and will complete the signal. This is having a clear effect and can persist over several bars (months).
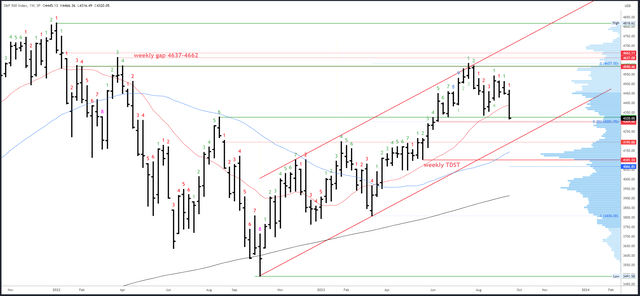
S&P 500 Weekly
The weekly contraction broke into expansion this week with a suitably large move. This broke the 20-week MA and the 50-week is way down at 4150ish. It also broke and closed below 4325-35 support.
More downside is likely and a test of the weekly gap at 4298-4304 is probable. This also lines up with the 38.2% Fib retrace of the March-July rally and is a decent spot to look for a reversal. Below that, the next supports are the weekly channel at 4200ish in confluence with the 4195 break-out area.
SPX Weekly (Tradingview)
4466 is the first resistance, then 4541 and 4607. A break of 4607 should lead to the weekly gap at 4637-4662.
4325-35 remains the key level on a closing basis next week.
A downside (Demark) exhaustion count will be on bar 2 (of a possible 9) next week. New counts are getting interrupted by the choppy conditions and a clean trend is needed to progress towards the next exhaustion signal.
S&P 500 Daily
Firstly, let’s address the prospect of a crash. When a market closes at the lows of the session, and especially the lows of the week, we have no idea if the selling is over or could intensify. Essentially, the clock was stopped on the action on Friday and will resume on Monday. There could be no bid on Monday and a large gap down would trap all longs who bought over 4325 since mid-June.
The “Black Monday” crash of 1987 came from the same basic conditions, although the Friday leading into the crash was down over 5%. Similarly, a mini crash of -8.3% on October 6th 2008 came after a weak Friday close at the lows of the decline. I could go on, but the message is clear: be careful as there is elevated risk.
Thankfully, the prospect of a crash might actually help the bullish case should the set-up fail. Last week, I pointed out a potential head and shoulders pattern, which is the most recognizable of all topping patterns. This has now triggered below the neckline of 4340 and has a target of 4093. Many will try and short this pattern and will place stops just above 4340 or even tighter at 4325. If and when this pattern aborts, it can lead to strong gains as bears are short in the hole and easily squeezed out.
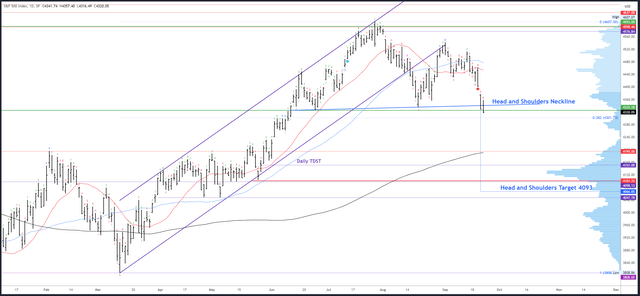
SPX Daily (Tradingview)
4335-40 is the first resistance, then 4375. Trading above 4430 resistance should confirm the low is in.
Potential supports are 4298-4304, then a measured move at 4271 with minor levels at 4261 and 4241. Major support is at the 4195 break-out level and the 200dma at 4191.
A downside (Demark) exhaustion count will be on bar 7 (of a possible 9) on Monday. A reaction is expected on bars 8 or 9 which suggests a bounce could develop from Tuesday onwards.
Events Next Week
Events and data are on the light side next week until Thursday when Powell speaks and claims/GDP are released. Consumer sentiment and the Core PCE Price Index are due out on Friday.
Markets are still reacting to the Fed’s hawkish FOMC meeting last Wednesday. Usually, only three or four sessions are needed to price in the new expectations as the market is rarely far off in the first place; the higher for longer stance is surely not such a massive surprise. However, that’s not to say volatility will die down – positioning has shifted massively in recent sessions and will take longer to adjust.
Yields look very near a top – a move back below 4.3% on the 10Y could cement a reversal lower.
Probable Moves Next Week(s)
More downside is very likely next week. But how will we know if the move is a bear trap into a bottom or actually a crash?
One approach is to let the market flush into a bull capitulation / bear trap which then recovers back over the head and shoulders neckline at 4340. A strong close over this level by Wednesday’s close could lead to short squeeze and an end of quarter rally back to 4375 and 4430.
This method mitigates risk, but forfeits a good deal of “reward.” To capture the full recovery, we would need to take on a greater risk and try and buy supports while there is till an elevated risk of a crash. If this approach is attempted, I would say any trade needs to work quickly and holding into a weak close is dangerous.
At this juncture, the first support area of 4298-4304 looks too close for comfort and only viable if there was a good bounce to around 4350-72 first. The next potential support is at the measured move/pivot low at 4261-71, but this has no confluence with anything on the monthly or weekly charts. 4190-200 is a much better cluster of support on all timeframes and a likely target if the market flushes lower into the end of the quarter.
My call for next week is actually unchanged from last week’s article. A bounce on Monday/Tuesday back to 4350-72 would set up a bear trap down to 4298-4304 where the market could bottom and recover back over 4340 to flip the charts back bullish. A drop on Tuesday / Wednesday would come on bar 8 / 9 of a daily Demark exhaustion signal, where a reaction is common.
The only difference between now and last week is there is now a set-up for a crash. The door is open lower, but I don’t think the market will take it. Just be careful of gaps down early next week or weak closes below 4320.
[ad_2]

")
")


")


