
[ad_1]

Darren415
This article was first released to Systematic Income subscribers and free trials on May 16.
In this article we discuss the latest quarterly results from the Business Development Company Sixth Street Specialty Lending (NYSE:TSLX). TSLX delivered a strong Q4 with a +4.1% total NAV return, continuing its sector outperformance. TSLX recently saw its valuation deflate relative to the sector average, due to a public stock issuance, which we view as an attractive entry point.
A big Q1 question mark for TSLX was its loan to Bed Bath & Beyond (OTCPK:BBBYQ) which declared bankruptcy in April. This was done after the end of the quarter so there is still some uncertainty as to the marks of the $76m position (5.6% of the NAV). Although the best outcome would have been for BBBY to succeed in its turnaround, a speedy bankruptcy is preferable to a slow bankruptcy which could further erode asset value. TSLX management said they are confident about the recovery of the loan at fair-value (loan was marked at par) and indicated there might be some upside from make-whole amounts. The liquidation process might drag into Q4, however.
TSLX also announced a public offering of 4.5m shares (0.675m greenshoe) at $17.6, about 4% below its previous close and about 6% above the NAV. Although a sharp drop in the price is optically unpleasant, a public offering priced above the NAV is a win-win for everybody. It allows the company to add new equity capital to either lower leverage or to finance new investments as well as organically grow fees (perhaps to hire more people etc.).
It’s also a win for investors in two ways. First, it is accretive to the NAV which generates a small positive return with no effort. And second, it temporarily depresses the stock price, allowing investors waiting in the wings to add to the stock at a more attractive price. TSLX remains in the High Income Portfolio and is worth a look for investors who were waiting to add the stock.
Quarter Update
Adjusted net income (adjusted for accrued capital gain incentive fees) fell to $0.55 from $0.64. This may seem unusual in a period of rising income in the sector, however, recall that the company had a non-recurring income of $0.12 in Q1. On this basis, recurring net income rose by a very respectable 6% from $0.52 and is 17% higher from Q3.
Systematic Income BDC Tool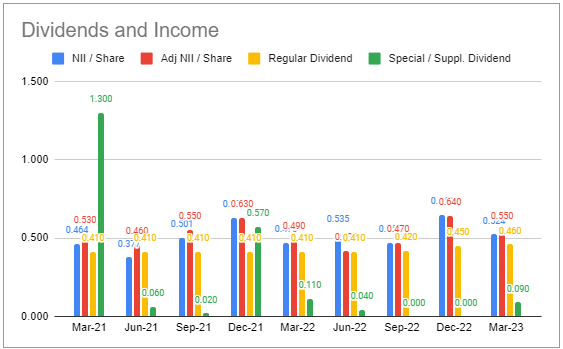
The company kept the base dividend the same at $0.46 (after three straight quarterly raises) and lowered the supplemental to $0.04 from $0.09 the previous quarter. This equates to a total dividend on NAV of just over 12%. Base dividend coverage is nearly 120% while total dividend coverage is a healthy 110%. Estimated spillover income at quarter end was $0.87 or about two quarters of the base dividend, giving the company some cushion in case net income moves lower.
The NAV rose 0.7%, primarily due to unrealized gains, outperforming the sector (defined as ~30 BDCs in our coverage).
TSLX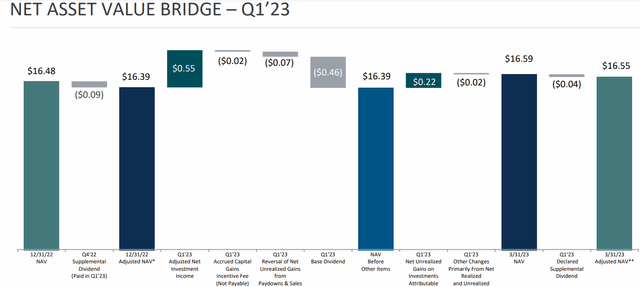
Income Dynamics
TSLX continued to add net new investments, supporting net income.
Systematic Income BDC Tool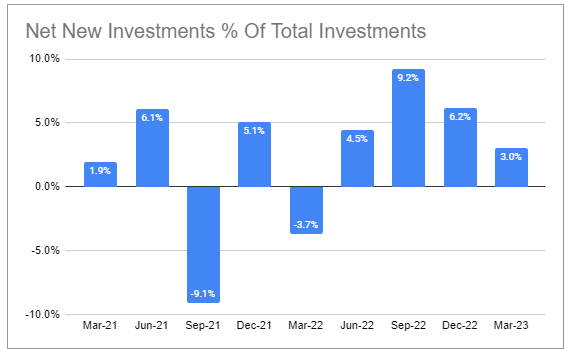
Leverage increased slightly to 1.2x (in line with the sector median level) over the quarter due to a low level of repayments. TSLX expect the BBBY loan to be repaid in the near-term which would push leverage lower, creating additional lending opportunities. The target leverage range remains 0.9-1.25x.
Systematic Income BDC Tool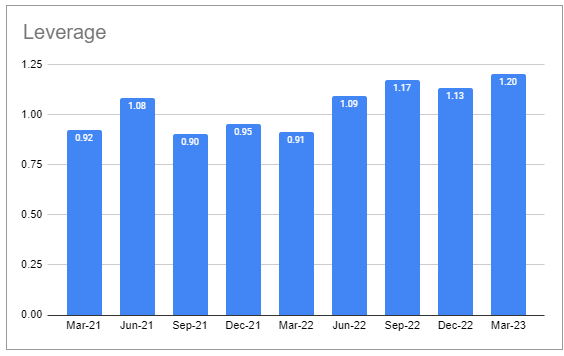
Weighted-average portfolio yield increased to 13.9% while interest expense increased as well (and at a faster rate).
Systematic Income BDC Tool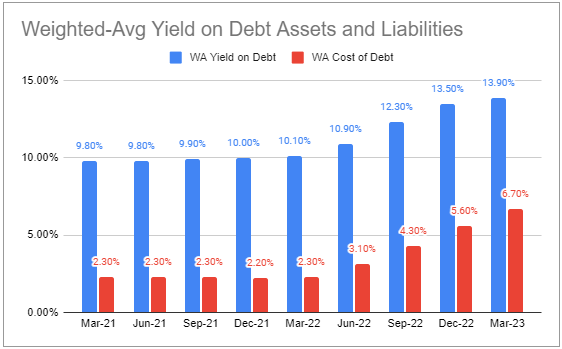
TSLX is unusual in that all of its debt is floating-rate. Its fixed-rate unsecured debt is swapped to floating-rates via interest rate swaps. To our knowledge it’s the only BDC that swaps their entire bond issuance.
The direct result of this is that TSLX has a relatively high cost of debt for its high rating. Other investment-grade BDCs have a cost of debt that is 1-1.5% below the level of TSLX. A number of BDCs were able to lock in coupons of 2-3% in 2021 when interest rates were low. By contrast, TSLX pays coupons of around 7% on its bonds. If there is a silver lining is that this disadvantage will diminish over the coming years if rates stay elevated as the bonds of other BDCs mature and are refinanced at higher coupons.
An additional income tailwind was that the yield on new investments was 13.8% in Q1 vs. 13.2% on exited investments.
Portfolio Quality
Non-accruals rose on a fair-value basis, however, importantly, no new companies were added to non-accrual. The increase was due to a different tranche of an existing non-accrual company (the only one) being placed on non-accrual. The current level of non-accruals is well below the sector median of 2.3%.
Systematic Income BDC Tool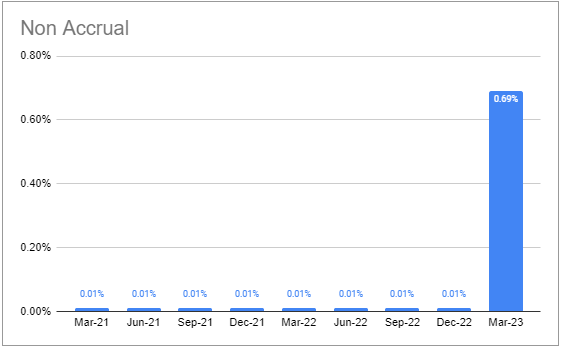
Overall portfolio quality, as indicated by internal ratings, improved slightly.
Systematic Income BDC Tool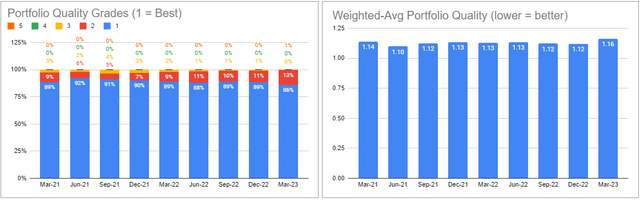
Management said that the portfolio companies had quarter-on-quarter revenue and EBITDA growth of 9% and 17%, respectively. Although we don’t know the granular breakdown (which might be more important), this aggregate statistic is a good one.
Return And Valuation Profile
TSLX has tended to trade at a premium valuation relative to the broader sector.
Systematic Income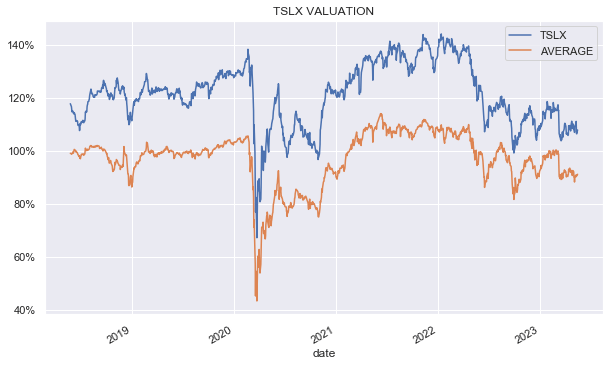
This makes sense in the context of its very strong performance.
Systematic Income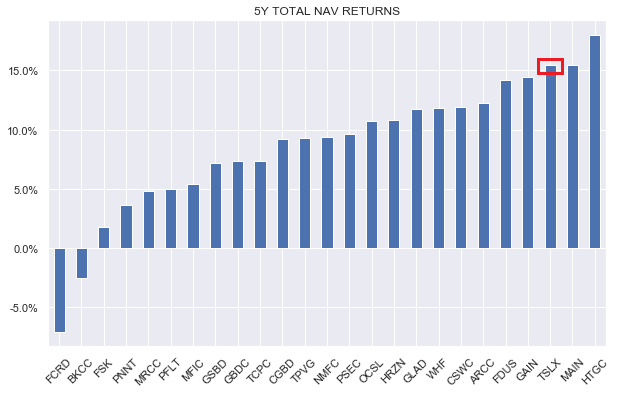
What’s particularly appealing about TSLX is its consistent performance as shown below. The trailing-twelve month average of its performance differential (yellow line) remains above zero for the entire 5 year period which is fairly unusual.
Systematic Income BDC Tool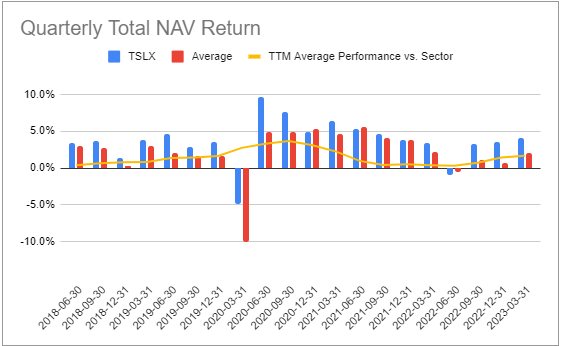
The question is whether its valuation is too high given its strong performance. The chart below plots BDC valuations against their 5Y total NAV return. We can see that TSLX is the cheapest of BDCs with a 5Y total NAV return north of 15%.
Systematic Income BDC Tool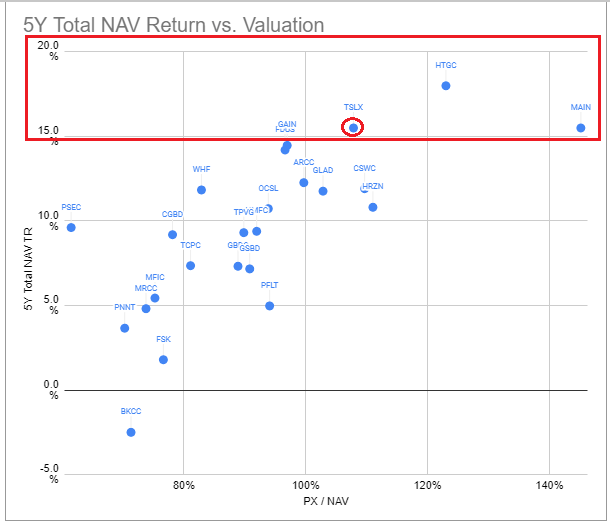
There are other BDCs with a slightly lower return such as FDUS (which we hold) and GAIN (which we don’t) that trade at lower valuations. What’s also interesting about this chart is that, while TSLX has delivered pretty much the same return as MAIN, it trades at a much lower valuation.
Another way to combine valuation and total NAV return is by dividing the two. By doing this we get a kind of normalized performance for a given unit of valuation. On this metric the stock also looks pretty good.
Systematic Income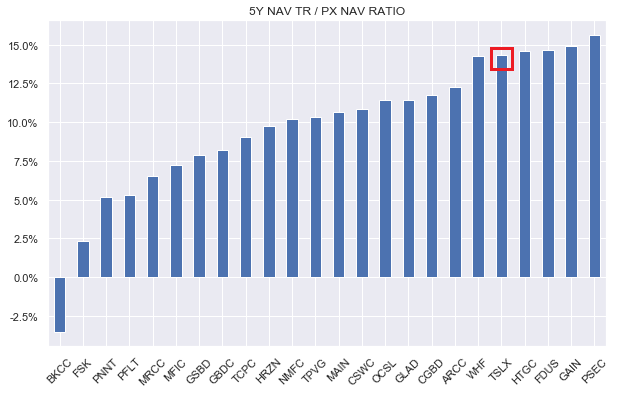
Stance and Takeaways
TSLX has a relatively unique element in its portfolio which is its retail asset-backed lending particularly in the distressed part of the market. Out of 25 transactions, 9 have gone through the bankruptcy process with no losses. The unlevered return of fully realized ABL investments is 21%. The BBBY loan looks to be another successful story here.
The company will soon be asking shareholders to approve its ability to issue shares below the NAV. This always raises concerns on behalf of shareholders who worry about NAV dilution (i.e. a drop in the NAV as a result of selling shares priced below book value). This request is very common on behalf of BDCs. TSLX has never issued shares below the NAV and, according to management, has no plans to do so. However, it is an option worth having in case of an air pocket in markets.
Another interesting comment from management is that the lending environment has not actually gotten more attractive in the last couple of months in the fallout of a number of regional bank failures. In fact, management said it has gotten more competitive. This likelihood is something we highlighted earlier given the imperfect overlap between regional banks and BDC market segments. Overall, the credit crunch does appear to be happening and there will certainly be greater individual opportunities for BDCs, however, we probably shouldn’t expect a sea change on this front.
Overall, TSLX remains an attractive BDC. It boasts very strong and consistent performance as well as a high-quality portfolio as indicated by a low level of non-accruals, high level of first-lien assets (91% vs. 81% sector median) and cumulative net realized gains over the last several years. Although its valuation remains above the sector average level, it is attractive relative to its level of outperformance. The recent dip in the price from a public stock issuance creates an attractive entry point.
[ad_2]

")
")


")


