
[ad_1]

RichVintage
Introduction
This article builds on prior signal event articles with more explanations on how to benefit some of our efforts. As more data points are collected, more insights are gained. The last Momentum Memo discussed the strong June 1 Momentum Gauge breakout signal that has led to the longest positive run of the year. This article will discuss many charts comparing current market conditions and the breakout signal that began 44 days ago.
Momentum Gauges Dashboard
Everything is great, until it is not. Current momentum across all the different market, sector, and S&P 500 gauges shows increasingly negative momentum conditions. The last time the Market Momentum Gauges were above Negative 40 significance level was back in May. Compare the six-month dashboard charts and sector gauge conditions between Aug. 4 and the breakout June 1 show below:
Current Aug. 4, Dashboard Gauges
Market gauge chart is on the left, S&P 500 gauge chart is on the right, and 11 Sector Gauge data are in the middle.
app.vmbreakouts.com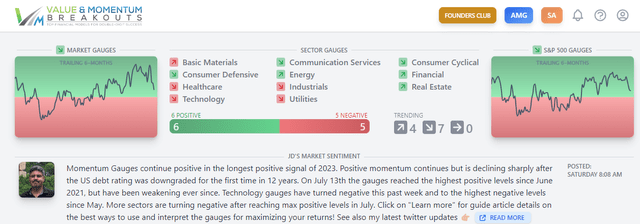
June 1st, Breakout Signal
The longest positive Momentum Gauge signal
app.vmbreakouts.com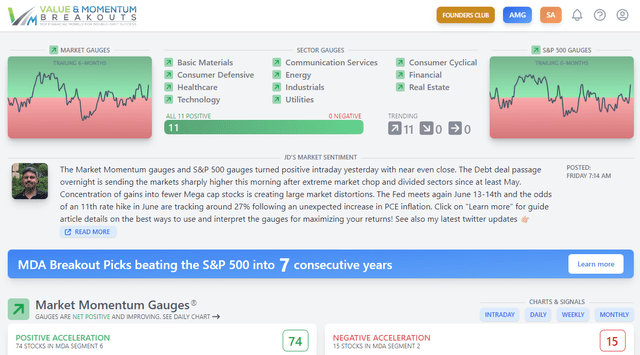
Guide: Maximizing Market Returns With The Automated Momentum Gauges
The recent US debt rating downgrade may not be the most significant economic impact for markets, but it may be the proverbial straw for the stock market camel to carry. The last time, 12 years ago, that the debt was downgraded, the S&P 500 had net declines for the next two months.
twitter.com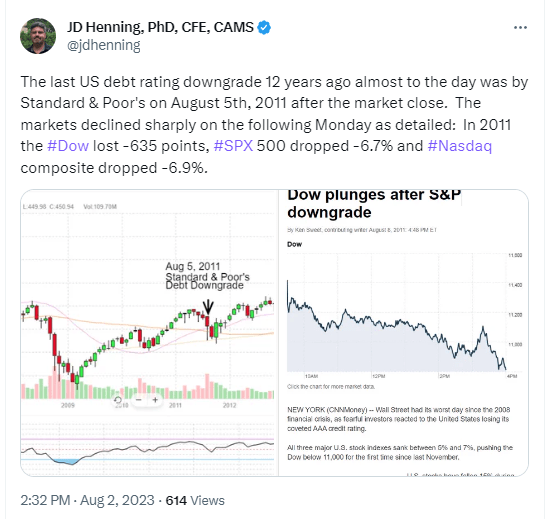
Two months of net declines in the S&P 500 would also be consistent with the cyclical patterns going back to 1927. Historically, July averages one of the best months of the year as it did this year, while September is by far the worst month of the year on average. Investors are likely to adjust to these patterns.
VMBreakouts.com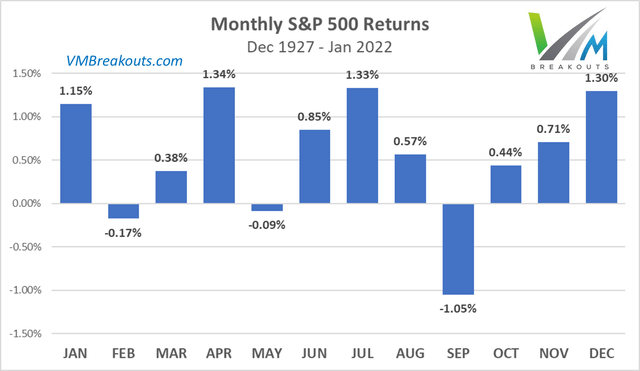
This pattern also follows the rise in VIX seasonal patterns back to 1990. Investors know this and often cyclical patterns become self-fulfilling reinforced trading behaviors.
Bloomberg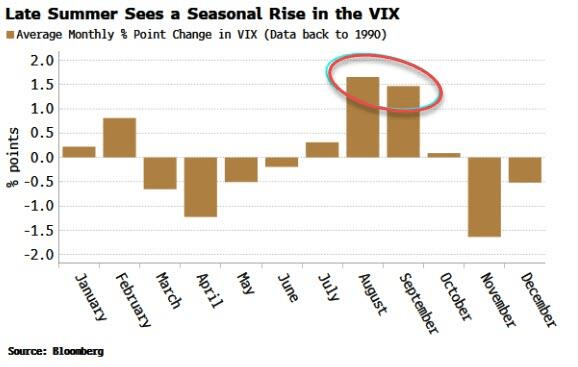
The US Dollar Index
Back on June 1 at the same time that the Momentum Gauges first turned positive 44 days ago, the US Dollar Index fund (UUP) was breaking down from the highest levels since November 2022. A lower dollar is generally better for markets.
VMBreakouts.com FINVIZ.com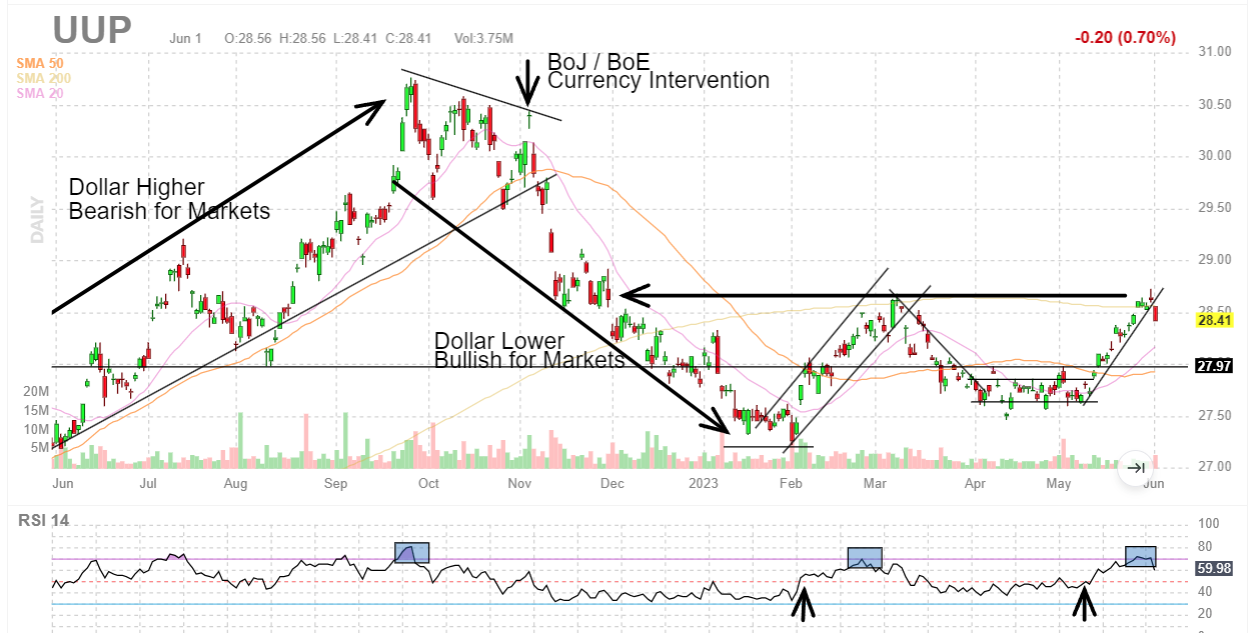
Fast forward to today, and we see the same US Dollar index rebounding from July 13th lows back towards the top of the range again. Remarkably, on July 14th we started the Momentum Gauge early test signal after 3 days of declining positive momentum.
VMBreakouts.com FINVIZ.com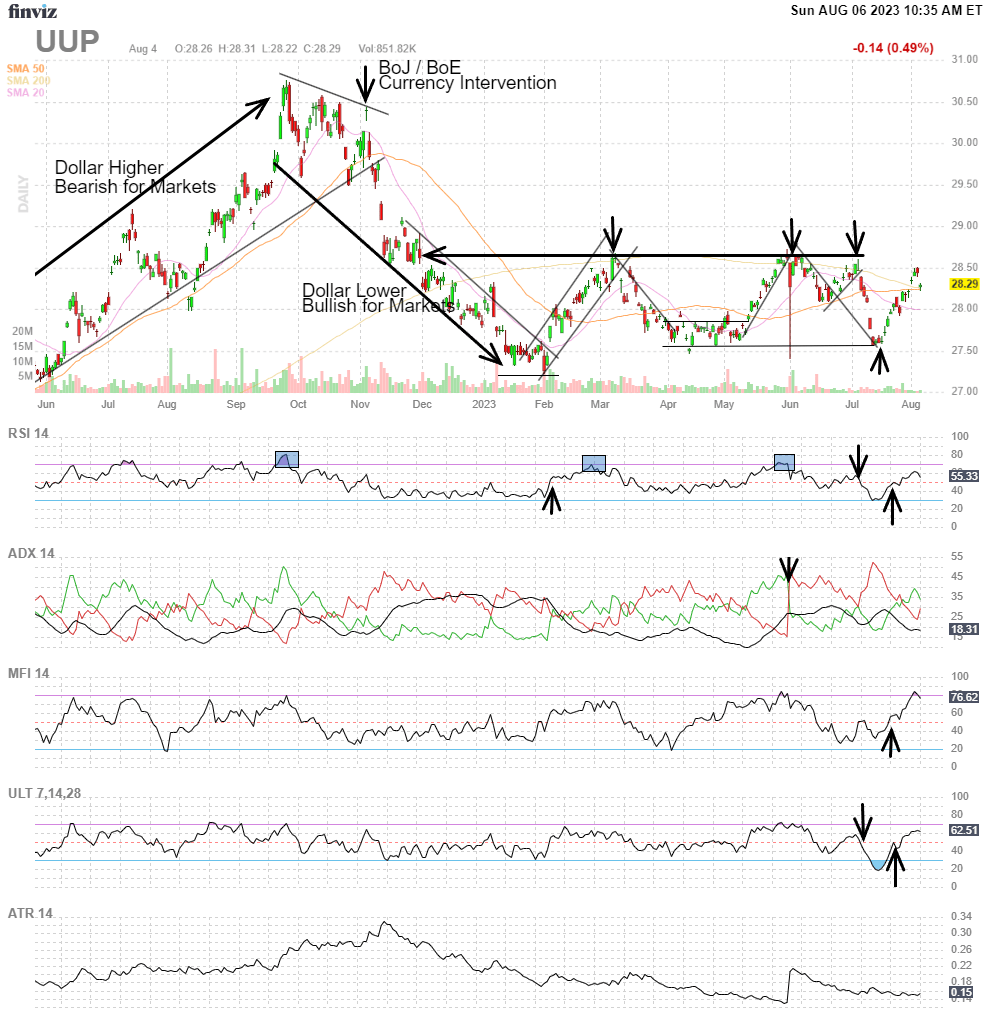
Current ETF Momentum Models
While the official signal continues from June 1st, we had an early negative test signal confirmed on July 14th. You can see the relative returns below with the June 1st ETF returns strongly positive (but off their highs), while the early negative signal from July is generating more gains except in small caps and Oil funds.
VMBreakouts.com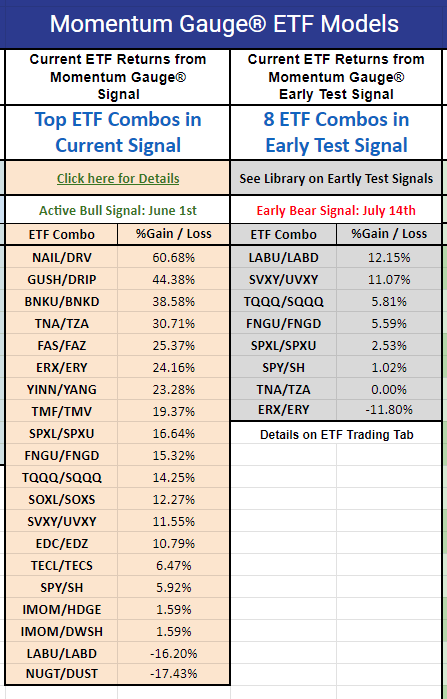
The strength in small caps and oil funds is consistent with the move toward more value and away from the mega cap tech that has led so far this year. This is detailed in another forecast back in June. If the market gauges turn negative, however, it will coincide with another top in the Russell 2000 index fund (IWM) pattern currently testing the top of the negative channel from 2022:
Momentum Mojo: Alternating Segment Breakouts Favor Oversold Value And Small Caps
VMBreakouts.com FINVIZ.com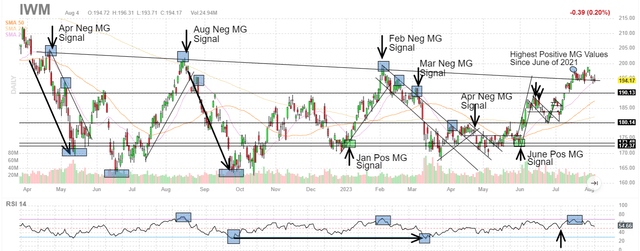
The January and June Positive signals have been the longest and strongest positive signals of 2023. However, the markets face a host of major headwinds discussed at the end of the article.
Technology Daily Momentum Gauges
Another leading indicator for markets has been the Technology sector gauges. They represent the largest sector both in number of stocks and the largest total market cap including both Microsoft (MSFT) and Apple (AAPL) giants. As I frequently remind readers, we have never had a major market correction according to available data without the Technology and S&P 500 gauges turning negative.
app.vmbreakouts.com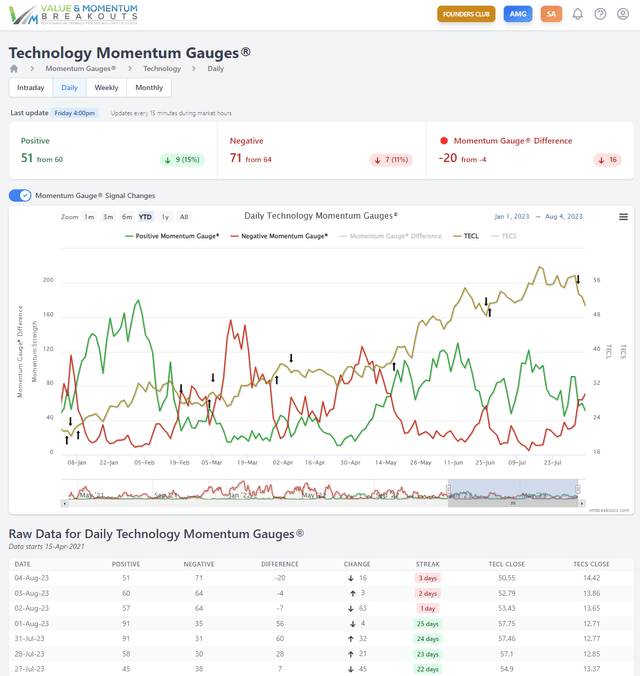
The Technology gauges turned negative mid-week two days before Apple had a sharp price decline on Aug. 4, following the Q2 earnings release after hours the day before.
FINVIZ.com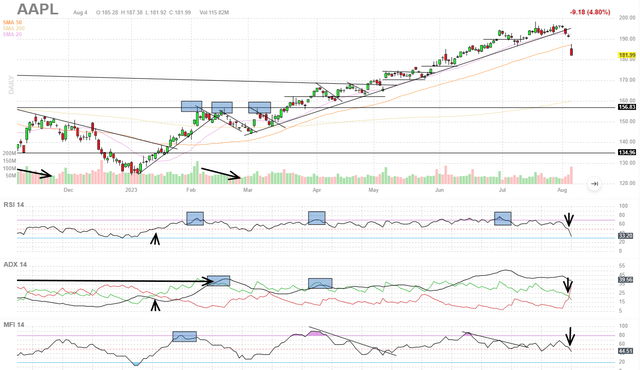
The latest one-week performance heat map by market cap shows some of the largest declines last week that we have seen in any week this year for the Technology sector. You can also see how the AAPL market cap size is larger than all the stocks combined in at least four different sectors: Energy, Real Estate, Utilities, and Basic Materials.
FINVIZ.com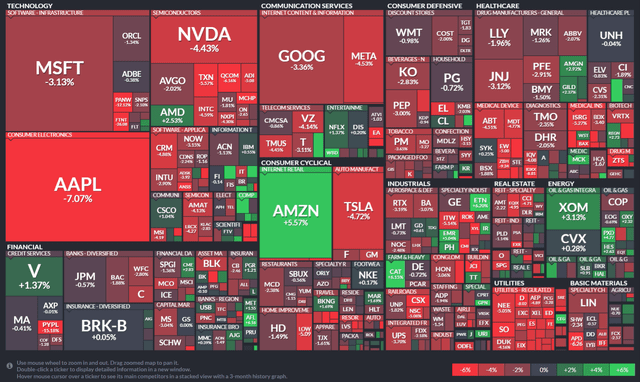
Uniquely Strong Headwinds for 2023
We have seen an incredible run in the market indices so far this year, particularly in the Nasdaq. The record gains have largely been concentrated in the 10 largest mega cap stocks, while the Dow is only up +5.8% this year (including huge gains in overweighted AAPL/MSFT). I have taken the view that when mega caps are in such extreme demand to the exclusion of so many other stocks it tends to reflect a safety trade more than a real bull market rally. Just as we saw in the March bank collapses, the largest bank failures since 2008, investors rushed to the mega cap banks that are perceived as “too big to fail.” Among many factors to consider, three major macroeconomic forces stand out to me this year.
Bankruptcies: Bankruptcies in the first four months of this year hit the fastest pace of bankruptcies since 2010 and double the 2022 bankruptcy rates. More concerns about CRE loans and lack of occupancy in some of the largest real estate properties in the nation add to this risk as interest rates reach the highest levels in 22 years.
S&P 500 Global Market Intelligence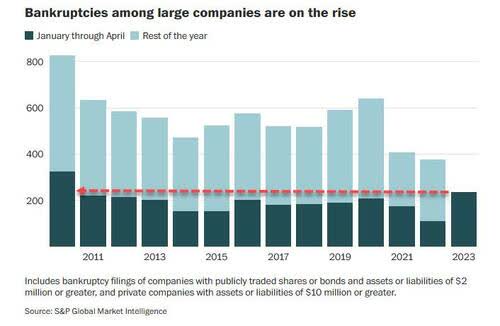
Interest rates: The Federal Reserve has hike interest rates at the fast rate in over 35 years. Not since 1977 have we seen a series of 11 rate hikes this large and this fast.
VisualCapitalist.com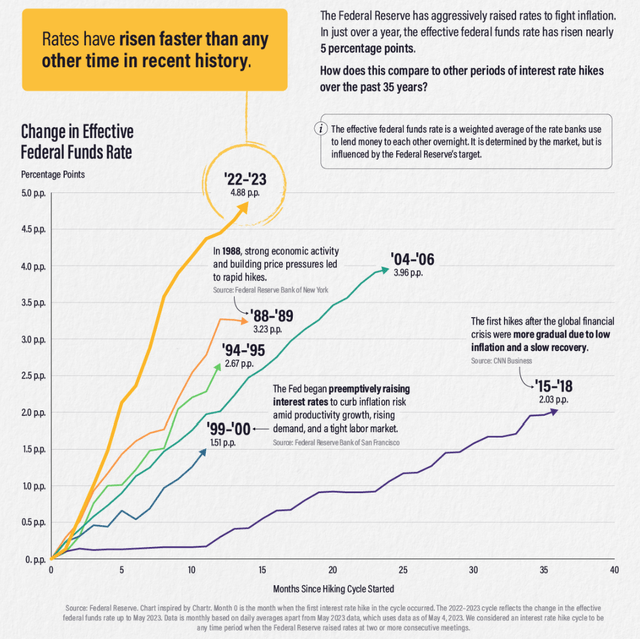
One thing we clearly know about Federal Reserve rate hikes is that in every prior series of rate hikes since 1969 the S&P 500 eventually sold off sharply. In most of the prior market corrections the declines did not occur until after the Fed paused or began cutting rates again.
Twitter.com Isabelnet.com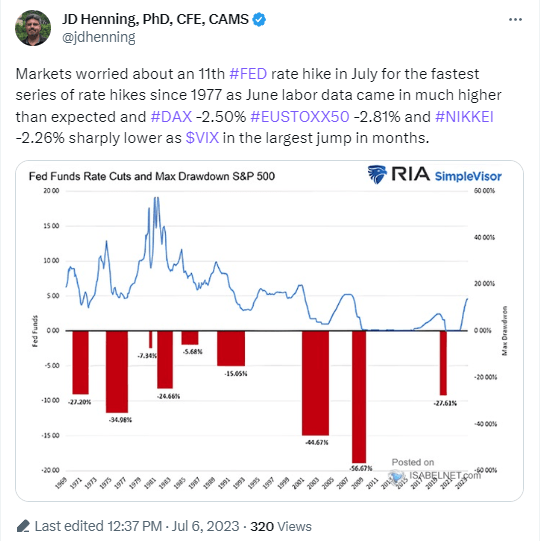
I have every reason to believe that this powerful economic tightening effect will have the same effect again on markets.
Quantitative Tightening: We do not know exactly the level of Fed balance sheet reduction that will make a major impact on markets. We do know that the Fed is continuing to reduce its holdings of treasuries at the fastest monthly reduction rates in US history. I’m certain that this is having an adverse impact on treasuries with record yield inversions and value declines. As I have written about at length in many articles about QT and market fund flows, the Federal Reserve accounts for one of the largest movers of stock market fund flows. So far since ending the most stimulative QE program in US history on March 9th, 2022 in response to COVID, the Fed has moved into the largest tightening program in US history. This program is eventually likely to produce the exact opposite results of all the prior quantitative easing programs designed to rescue declining markets.
The Fed Unveils The Largest QT Program In History: How The Markets May React. Fed Promises Faster Moves On Largest QT Program In History.
Fed Quantitative Programs since the Financial Crisis
The S&P 500 fund (SPY) chart below is used to illustrate the timing of the different major Fed intervention policies to stimulate markets in QE 1 to 4 and the effects of the 2018 tightening events, our only prior QT events to the current program.
FINVIZ.com VMBreakouts.com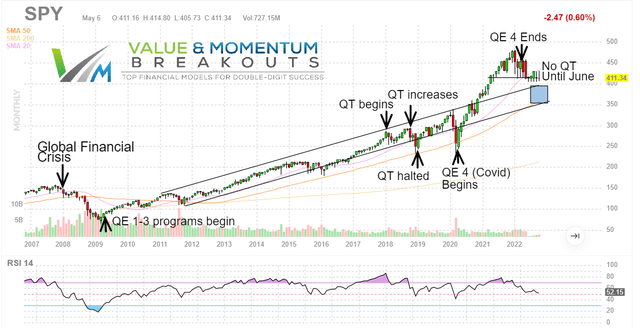
Conclusion
In the recent FOMC rate decision in July, the Federal Reserve extended their battle with inflation saying that they do not expect inflation to reach their 2% target until late 2024 or 2025. While the Fed may pause soon after 11 rate hikes, this constricting policy of reducing liquidity through higher credit standards and higher borrowing rates has always had an adverse impact on momentum and markets.
My long-term forecast for 2023 remains unchanged, but like the Federal Reserve indicated, it may take longer for the effects of their policies to make an impact.
I hope this article and momentum gauge indicators will give you all the time you need to prepare for an inevitable market “landing,” whether soft or hard.
I wish you the very best in all your trading decisions,
JD Henning, PhD, MBA, CFE, CAMS.
[ad_2]

")
")


